
Why Digital Marketing Matters
Digital marketing is a vast, varied, and wild landscape. This lesson is the perfect place for newcomers to start their journey into that unknown terrain. A simple understanding of a few key digital marketing landmarks will make your journey all the easier.
We’ll introduce you to some digital marketing strategies and general principles that will stand the test of time. So, take what you learn here and stretch it to meet your marketing needs.
What You’ll Walk Away With
At the end of this lesson, you’ll know:
- What our definition of “digital marketing” is
- The basic components of a digital marketing strategy
- How to get started with a digital marketing campaign
Defining Digital Marketing
Digital marketing is a generic term that can include all kinds of online marketing activities, as well as some digitally-enabled offline marketing activities. So depending on how you break it down, digital marketing can encompass a lot.
For the purposes of this lesson, we’re exclusively talking about these marketing activities:
- Website tracking
- Search engine optimization
- Online advertising
- Marketing automation
- Conversion rate optimization
How to Approach Digital Marketing
Understand the Goal of Digital Marketing Efforts
All of your digital marketing activities ultimately feed into a few types of business goals.
Some of the most common goals of digital marketing campaigns include:
- Influencing behavior (e.g. Stopping smoking)
- Driving engagement (e.g. Playing more Pokemon GO)
- Increasing awareness (e.g. Introducing new product line)
- Providing support (e.g. Calming frustrated customers)
If your digital marketing efforts do not align with your business’s goals, then any promotion you do is largely an exercise in vanity; you’re doing it because you’ve seen others do it, not because it’s actually having an impact on the business’s bottom line.
Each and every one of your marketing initiatives should be traceable to a business goal. That is, you should have some idea of your expected outcome. Once you’ve identified an outcome, you can measure marketing efforts’ success by matching efforts with tracked outcomes. Then, you just need to keep making incremental changes to make your effort even move valuable. We discuss incremental improvements more in our lesson on prototyping.
When [situation description], I want to [motivation description], so I can [expected outcome].
E.g. When [doing online advertising this Christmas], I want to [attract would-be Game of Thrones card buyers], so I can [sell more cards from my Game of Thrones product line].
This framework helps you establish an expected outcome and start defining marketing efforts needed to achieve it. The example used establishes that the Christmas marketing efforts will primarily involve paid advertising, b) card sales are the ultimate outcome of the efforts, and c) the campaign should specifically target Game of Thrones fans because the goal is to sell more cards from the Game of Thrones product line.
- Our lesson on intent and the buyer’s journey
- Our lesson on understanding conversion rate optimization
- Our lesson on understanding web tracking
- Intercom’s adaptation of job stories for designing UI/UX features
- Google’s help article for setting up goals in Google Analytics
- Kissmetrics’ blog post on the most essential types of website goals
Embrace Your Audience

Your audience’s continuing interest is what allows your business to exist.
Prospective and actual buyers, subscribers, and other supporters all exchange their time and money for brand’s your goods and services. So, you need to make their time and money worth it and you want to keep them coming back.
Audience interest in your brand’s product and services goes well beyond the actual transaction. For most transactions, people spend a lot of time online researching before and after the transaction.
This makes it critical to have a firm understanding of:
- What your audience wants
- Where your audience looks for what they want
- Who your audience is and how they behave
This way, if anyone ever asks, “Should we be marketing on ______?” Then, you can say something like… “If our audience is there, we should be there. And my understanding is that X, Y, and Z are where more members of our audience can be found, so that’s where our resources should go. But if you wanted to increase the budget for our campaigns…”
Know Your Marketing Channels
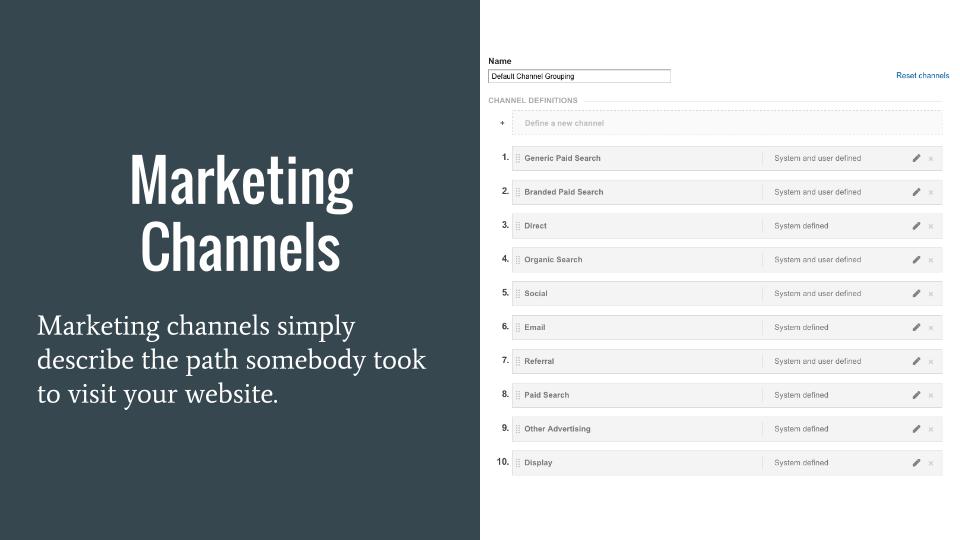
Measuring campaign performance is essential to understanding what your audience actually wants. And one of the most basic ways to measure campaign performance is by marketing channel.
Marketing channels are simply a way to group your web traffic. Channel definitions will vary slightly from place to place and person to person (e.g we consider remarketing to be its own channel).
The most common marketing channels for grouping web traffic are:
- Direct: With strong enough brand recognition, some users may start their online journey straight from your website. For example, I’ll occasionally start a browsing session by typing in theoatmeal.com.
- Search engines: About 1/2 of all web traffic originates from search engine results, i.e. unpaid, organic search results with websites ranked based on content relevancy.
- Social media: Traffic from information and entertainment hubs, like Facebook or Reddit or YouTube, where users engage in some kind of dialogue.
- Paid advertisements: Any traffic generated from paid-for placements on websites, e.g. social network ads, sponsored emails, etc. This traffic can be further categorized into search ads, display ads, and then other types of advertisements.
- Email: Traffic that originated from hyperlinks in emails.
- Referrals: This segment of traffic is for identifying which websites are sending visitors to your website. For example, clicking the link to theoatmeal.com above would be a referral from this website to their website (i.e. they see “academy.webmechanix.com” as a referral source).
Your audience members, their expectations, and their current stage in the buying decision will all vary by channel. Generally speaking, a multi-channel digital marketing strategy can dramatically increase the impact of your campaigns by providing valuable content at every stage of the buyer’s journey.
In some instances, one channel (e.g. social media) will be a good driver for awareness, while another channel (e.g. paid ads) will be better served toward the end of buying decision.
It’s important to note that you don’t always have to use every channel for every campaign — sometimes it’s a matter of priorities and sometimes it’s a matter of a channel simply being a poor fit for accomplishing your objectives.
Appreciate Your Existing Assets

Marketing is all about promoting something that exists or will exist.
The best marketers will identify existing content and other assets supporting the product or service that will be promoted. They can then build campaigns around these assets, using their resources on creative and ad placements, rather than starting everything from scratch.
Some examples of types of existing assets you can use in your marketing campaigns include:
- Webpages
- Blog posts
- PDFs
- Email copy
- Videos
- Presentations
- Offline materials
Another asset type is the people at your company or your partners. If you have a well-respected subject matter expert on staff or on-call, then you need to leverage that relationship!
The main takeaway here is to avoid having to start from scratch for every campaign. Sometimes the pieces already exist and they simply need to be unearthed or rearranged. And if you have something that’s worked before, why wouldn’t you want to use it again?
Ask for Help

Digital marketing is simply too complex for any one person to know and do everything.
There will always be more marketing activities than there is time in the day. And there are always fewer resources available than you’d like.
So, sometimes the best thing you can do is admit you need help. Sometimes you need a specialist. Other times, you simply need some extra hands on deck to help push out a campaign.
If you think you need help, then make sure you fully explore your options. Ask the vendor or consultant for examples of success in the same or a similar industry. Get client references and call them. And remember: you get what you pay for.
Try These Marketing Exercises
Complete the exercises below before moving on. You’ll gain critical hands-on experience that will help you become the marketer you were meant to be. Plus, it makes completing the quiz at the end of the lesson even easier.
Exercise A: Requesting Access to Google Analytics
Gaining account access is a critical first step for any kind of digital marketing project. It’s important to establish a baseline of website performance so that you know if your efforts are having a positive or negative impact, regardless of whether the digital marketing project directly impacts the website (e.g. redesign, content creation, etc.) or indirectly impacts the website (e.g. paid ads, social media posts, etc.).
Exercise B: Identifying Top 3 Traffic Channels
Identifying what’s already working well for a website is generally one of the first things you want to find out when doing digital marketing for a website. Once you know what’s already working, you can begin prioritizing your marketing strategies for a) making the traffic from those channels more productive and b) invigorating underperforming traffic channels.

Lesson Goal
By the end of this lesson, you should know:
- What the Google display network is and how it differs from the search network
- The ad formats that can be run on the display network
- How to set up a display campaign
How Do Display Ads Work?
Google’s display network consists of sites, blogs, videos, and apps that show AdWords ads. It places your ad on relevant sites by:
- Looking at your keywords to determine which sites are related
- Allowing you to select specific sites where you would like your ad to appear, called placements
- Targeting individuals who have visited your site or have specific interests
Types of Display Ads
There are four types of ads that can appear on the display network:
- Text ads. These look exactly like search ads, but appear on websites other than Google’s search engine.
- Image ads.
- Rich media ads. This ad type includes animation or movement of some kind.
- Video ads.
Display ads are meant to capture users’ attention and encourage awareness throughout their sales journey. Search ads come into play when users are further involved in the process and are actively looking for a product or solution to their problems.
While most people do not click on display ads, simply viewing them can influence their purchase decisions in the future. There’s a great piece on Marketing Land that discusses these differences.
How to Set Up a Display Ad Campaign
Now we’ll review the steps of creating a display ad campaign. We’ll go into more detail about available options and recommendations as well.
Campaign Types
Creating a display ad campaign is a bit different from making a search campaign. When making a new display campaign, you’ll have three options for campaign type, which determines where your ads will be shown:
- Display Network Only. Ads are shown on:
-
-
- Sites that show relevant Google Ads
- Apps
- Videos
- YouTube
- Gmail
- Google Finance
- Google Maps
- Blogger
-
- Search Network with Display Select. Ads can appear on the search network as well as on relevant placements in the display network. In this case, budget is shared between the networks, and display ads will be shown more judiciously.
There are also two campaign sub-types. These have different settings under different campaign types. Here are the features for the sub-types of a Search Network with Display Select campaign:
- Standard. With this sub-type of campaign you have access to basic location and language targeting, basic bidding and budgeting, and popular ad extensions. This type is not available on display network only campaigns.
You do not have access to more advanced options, including the display network tab which includes placements, remarketing, demographics etc, social options, ad scheduling and delivery options, advanced keyword matching, and more. In addition, you can only include text based display ads.
- All Features. This option includes everything from the standard option, as well as the display network tab. It does not include interest category, gender, age, etc targeting
An often used display network only ad campaign type is remarketing. In this case, display ads are shown on the display network to individuals who have already visited your site.
For more on these differences, check out this reference page from Google. Choosing the right campaign type is important, because it’s not recommended that you change it once the campaign has started.
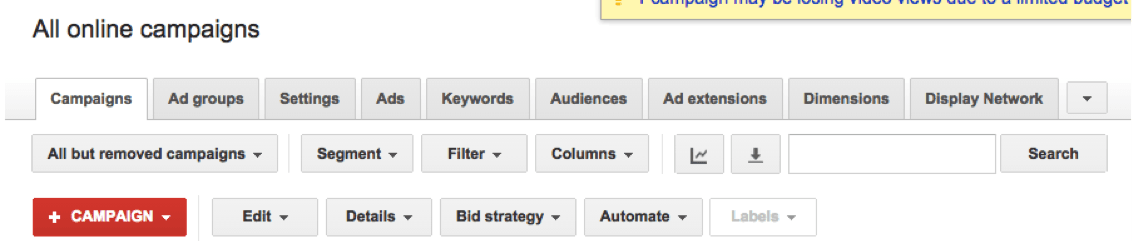
For Things by Bean, we’ll make a Search Network with Display Select campaign. Once we’ve logged into our AdWords account, we’ll go to the Campaigns tab and click the red + Campaign button.
Then we’ll be directed to name our campaign and select the campaign sub-type. We’ll pick the All Features option.
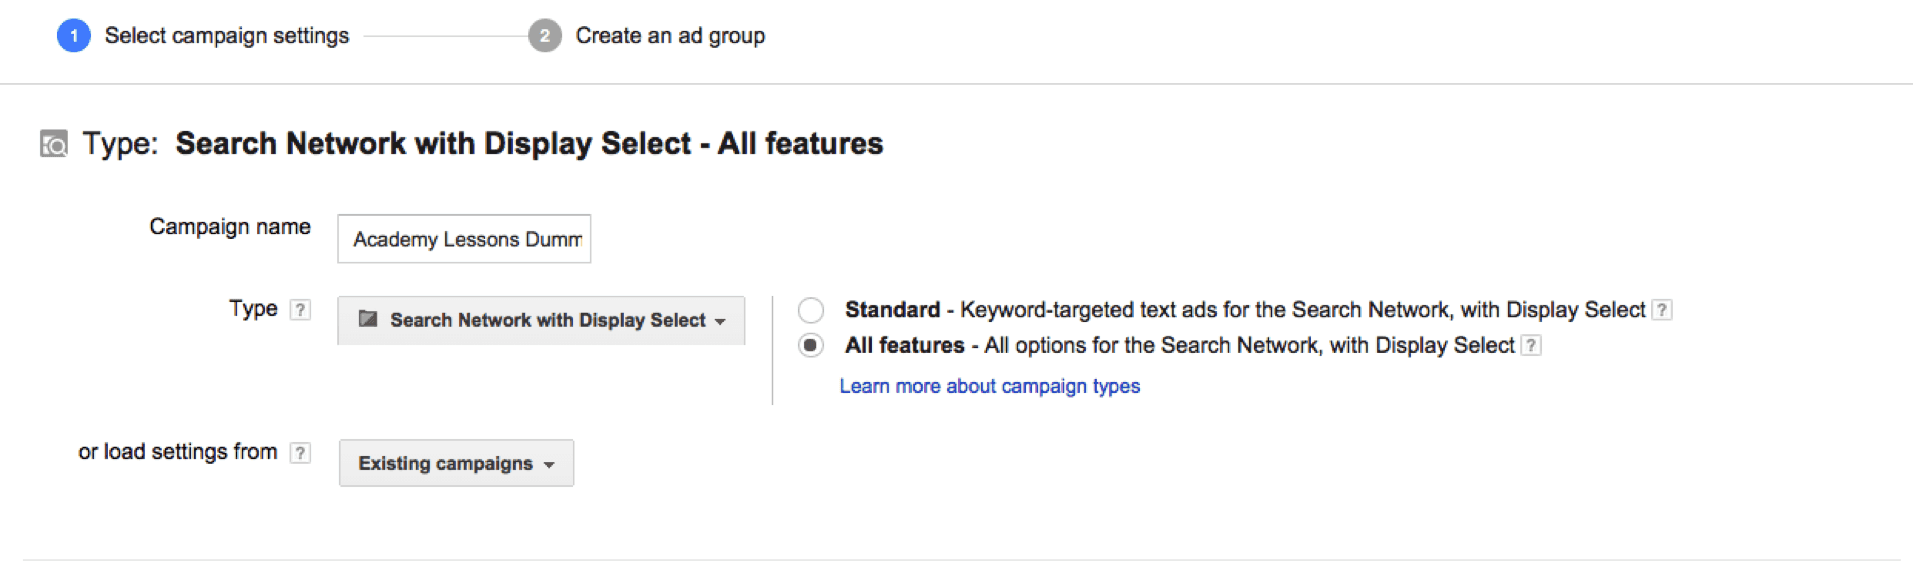
We can then choose if we want to include Google’s search partner network (we do), where we want our ad to show geographically, and if the ad should be shown on online and local shopping channels.
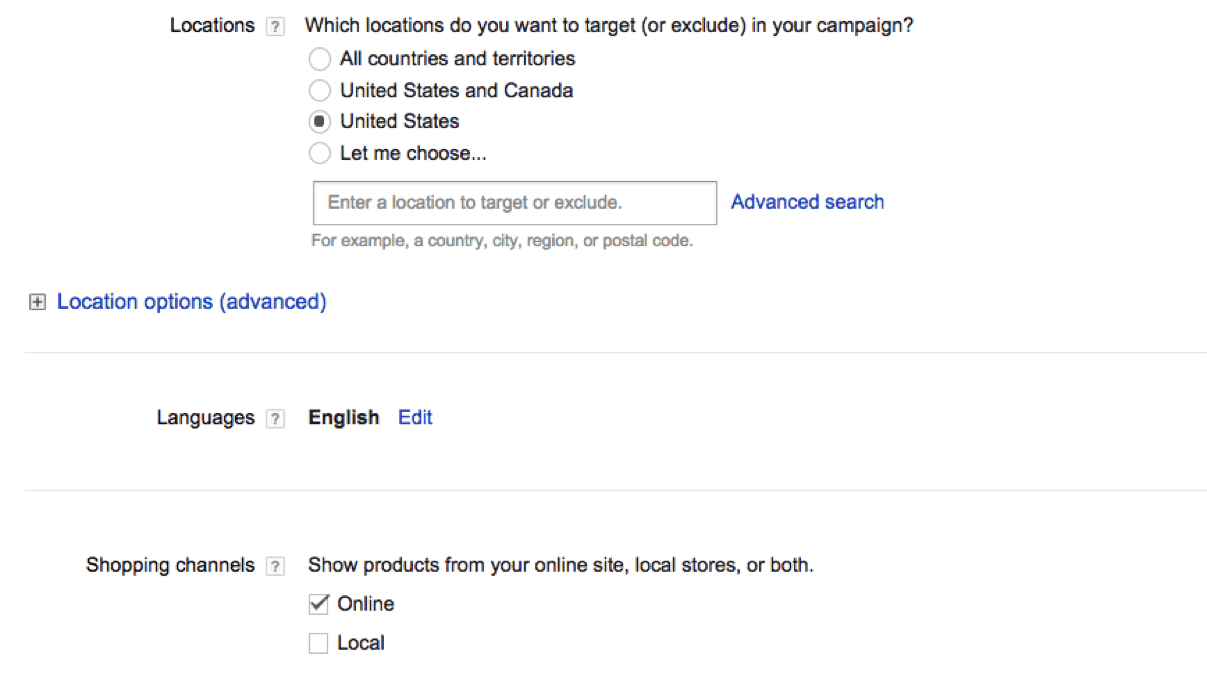
Bidding
Bidding options for the search network with display select are the same as those for the search network. You can bid manually, or set automatic bidding. In the advanced options section, you can also optimize for clicks, use enhanced CPC, or optimize for conversions.
Bidding options for the display network only include cost per impression bids. In this case, you pay per thousand ad impressions.
On the display network you can also set default bids and bid adjustments, like with search advertising.
Once you’ve set up your campaign and adgroups, you can change the bid for a keyword or keywords by selecting them with a check box and either changing the amount in the Max CPC column, or clicking Change max CPC bids in the Edit dropdown.
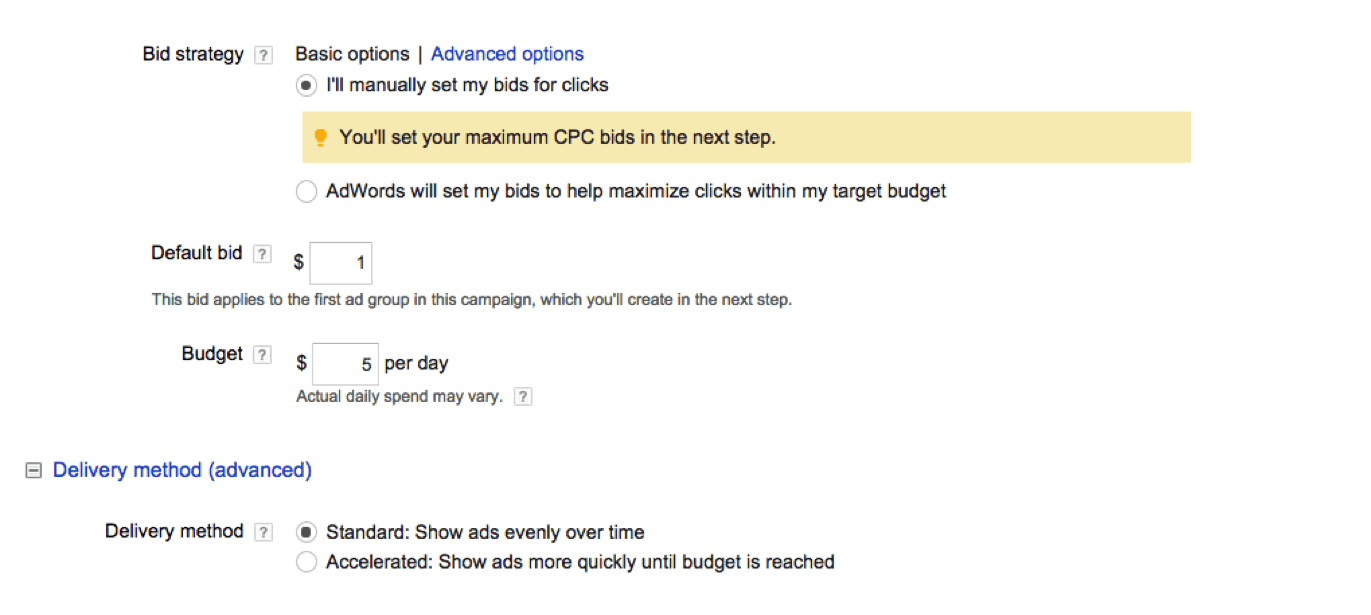
Other Settings
Next, we decide if we want our ads to be shown evenly over time, or if we want them to be shown at an accelerated rate. We recommend having ads show evenly over time so you can reach users who go online at different times equally.
Ad extensions, which give you added abilities like links and additional text, can be selected in the next step. We’ll include a location extension to show Things by Bean’s store location.
We then move to the advanced settings section, which contains the following:
- Schedule: Start date, end date, ad scheduling. Here you can decide the time frame for when you want your ads to show, and specify specific days of the week and times you want your ads to be shown.
For our example, we’re not going to make any specifications, because we want to gather data about our audience before we make limitations.
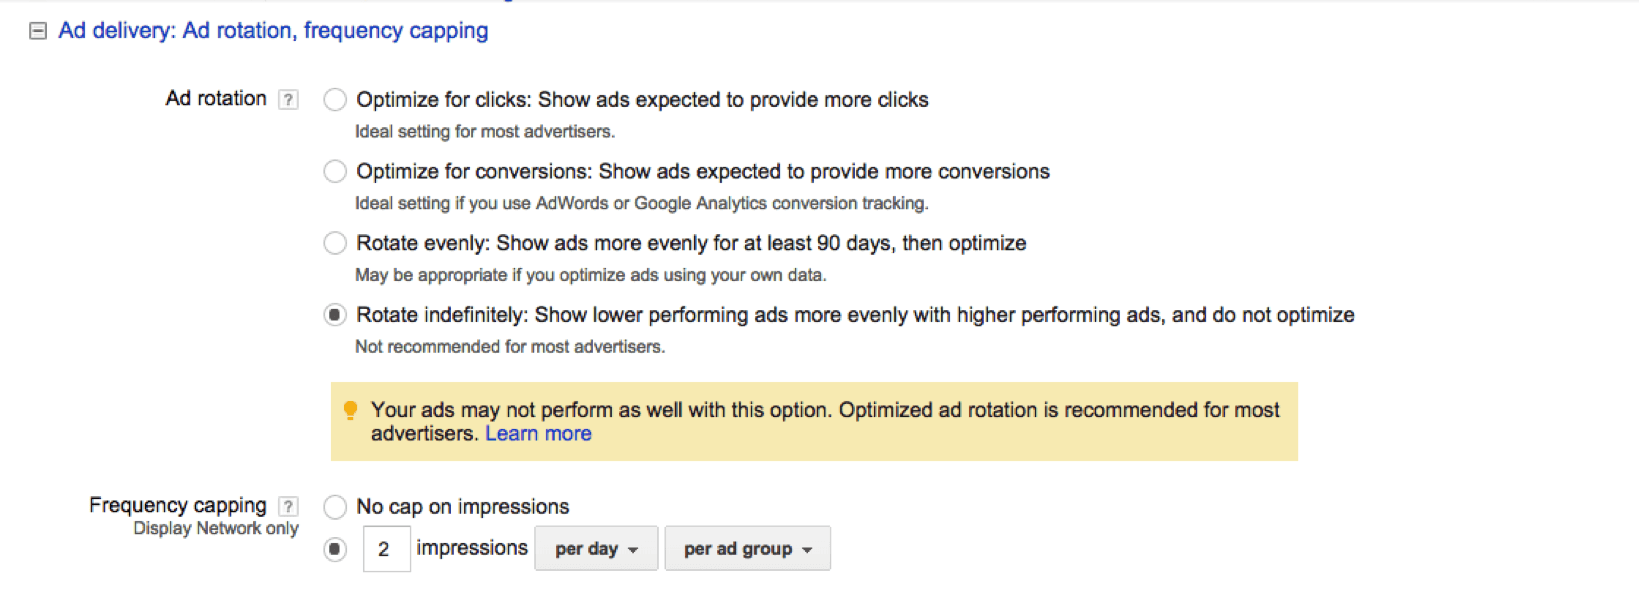
- Ad delivery: Ad rotation, frequency capping. In this section, you can decide if you want your ads to have an equal chance of being shown, or if you’d like to optimize them for clicks or conversions.
We’re going to rotate our ads indefinitely. This way, we can gather data and decide if and when we want to optimize our ads later.
The frequency capping option lets you limit how many times an individual can see your ads. You can limit the number of impressions by day, week, or month. You can select if you want that cap to apply to a single ad, an adgroup, or an entire campaign.
Typically it’s better to cap impressions at 5 per day. We’ll limit the number of impressions per adgroup per day to 2 for our Things by Bean.
We’re not going to go into dynamic links or search ads, as that’s more advanced.
Creating an Adgroup
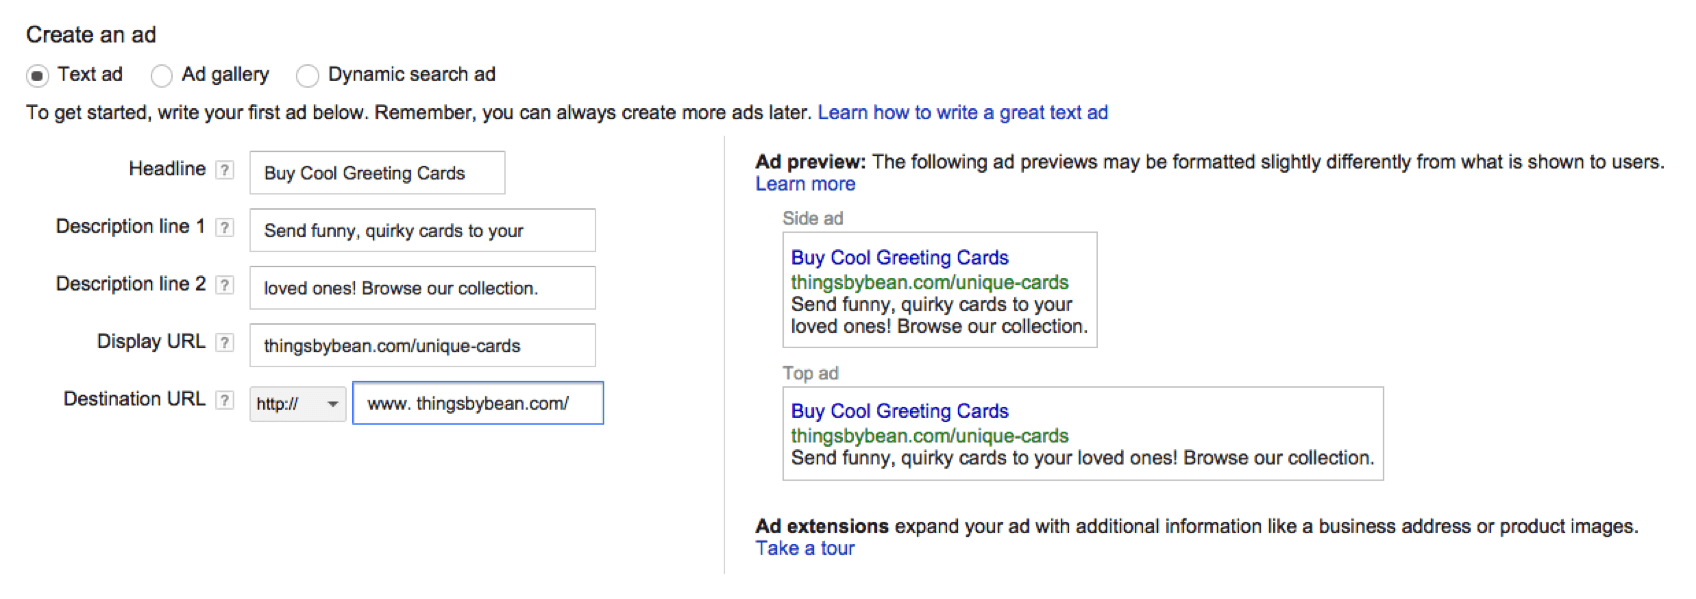
Once you click save, you’ll be prompted to create your first ad and adgroup. Your first ad is a text ad, but once your adgroup has been saved, you can make other types of ads.
Now we’ll add our keywords. These keywords must be specific to our product and site because they will not only impact when our search ads are triggered, but also where they will be shown on the display network.
You can add negative keywords after you’ve created your campaign and adgroups by clicking on the Keywords tab and scrolling down to the Negative keywords section, then clicking Add.
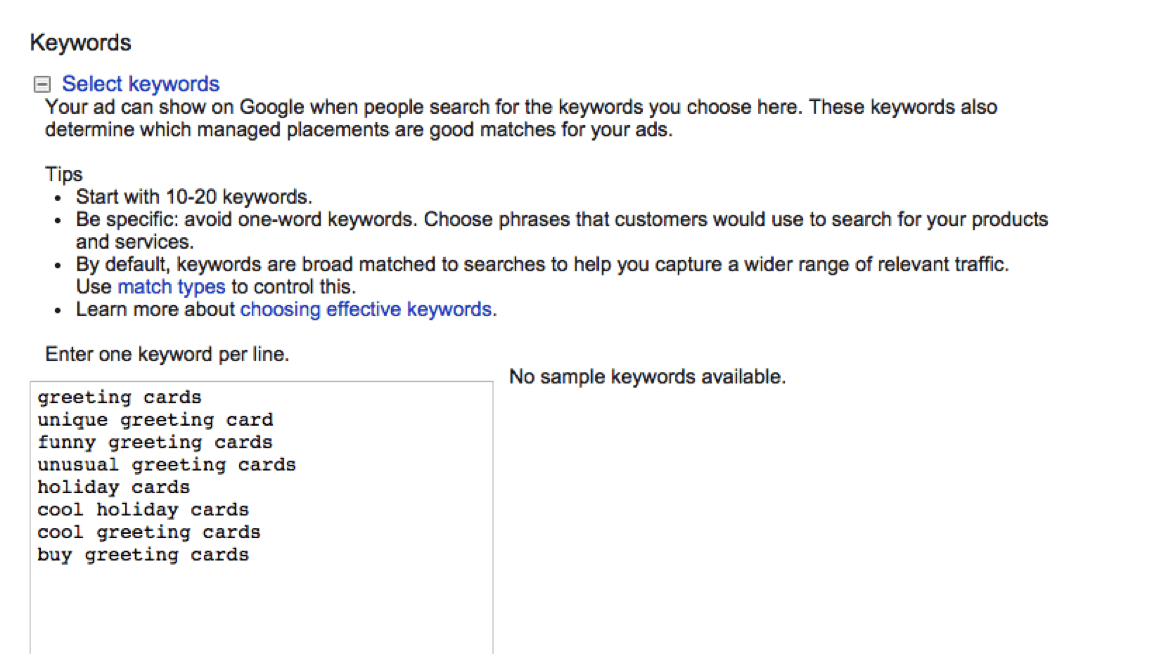
We’ll also get to review our chosen max cpc, and then we can save the adgroup. Our first ad will be up and running!
If you want to check all your settings and make more ads before you start your campaign, click the green dot next to the campaign and select Pause. This will enable you to keep working and your ads won’t go live until you’ve re-enabled the campaign.
Placements and Remarketing
We’ve selected the keywords we want to trigger our search ads, which will also be used to place our ads on relevant sites. To further narrow our target audience, we can create placements and remarketing efforts.
Placements
Under the Display Network tab, click Placements.
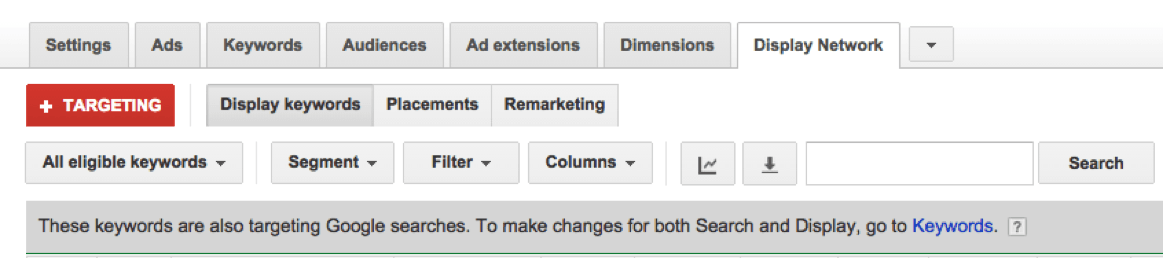
Then we’ll click the red + Targeting button, followed by selecting Placements in the Add targeting dropdown menu. Now we can enter or search for a site where we want our ad to appear.
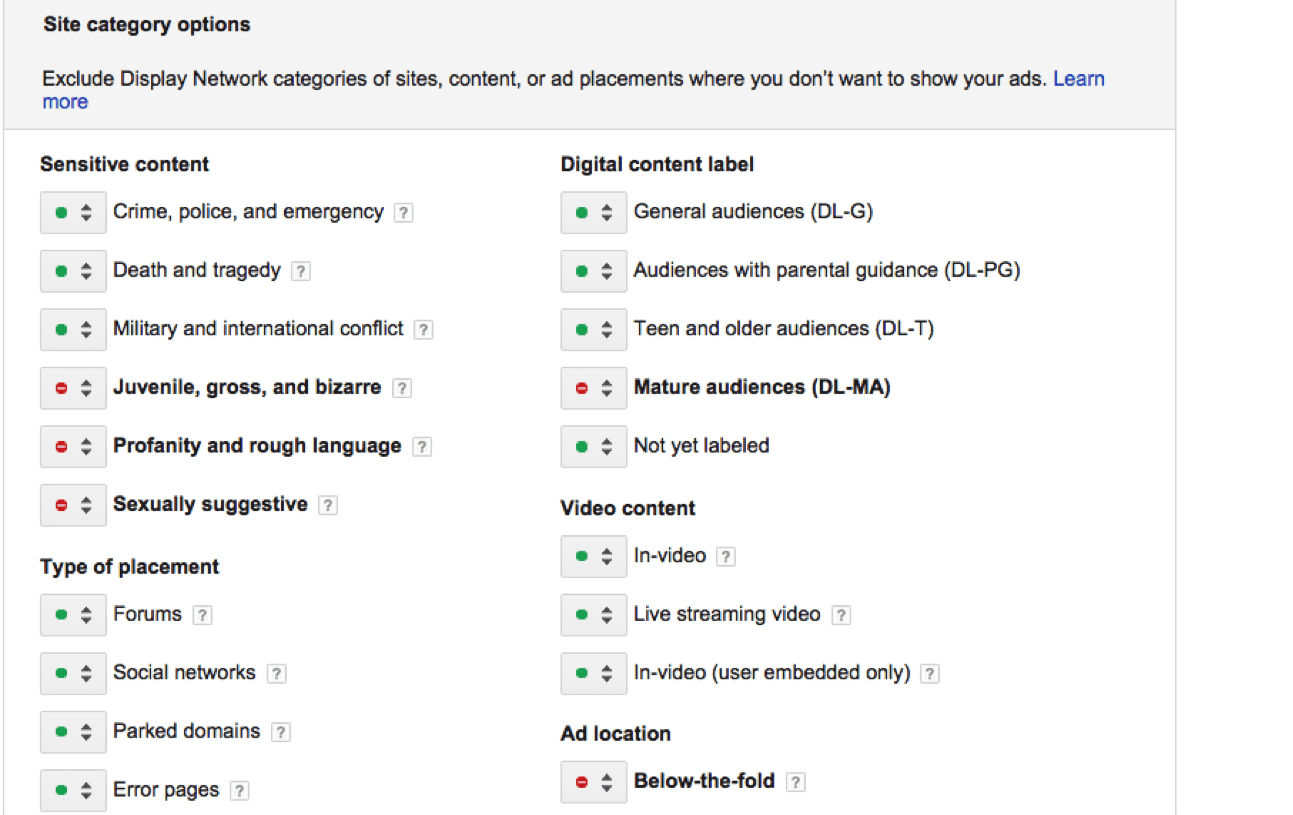
On this page, we can also specify exclusions, such as words we don’t want to trigger our ads, types of sites we don’t want our ad on, etc. Here we can choose if we are ok with our ad being shown in videos, or below the fold of the page as well.
For Things by Bean, we don’t want ads for our products to be on inappropriate sites, and we want our ad to appear above the fold.
Remarketing
You can also select who will see your ads based on their previous interactions with your site. In the type of campaign we chose, this option is under the Audiences tab. Now we’re going to click the red +Remarketing button.
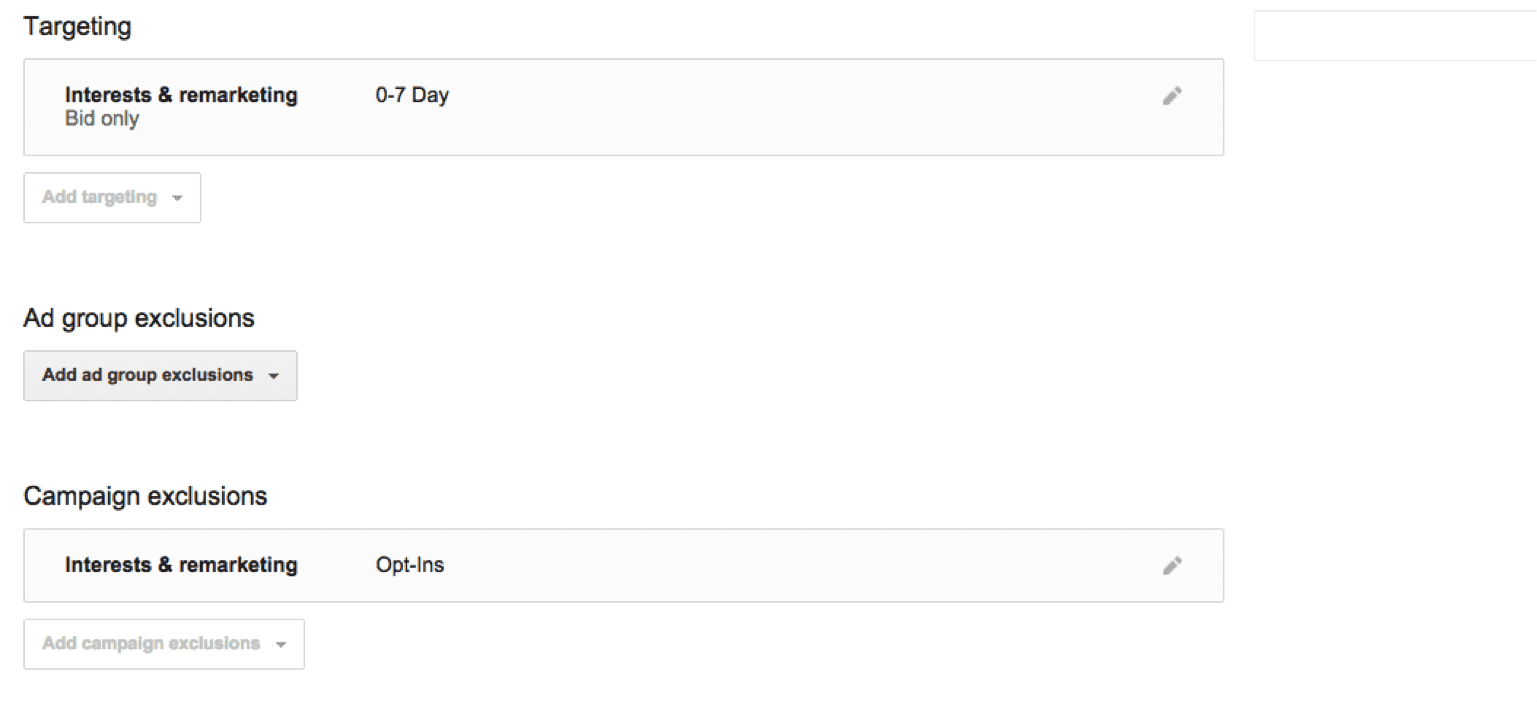
Next, we’ll click the Targeting dropdown and Interests & remarketing. Now we can target individuals who have visited our site recently, or decide to exclude them. You must first have a remarketing list in place. To learn how, click here. We’ll also choose the Bid Only option, because we do want to have these ads shown to those who might not have visited our site yet.
It’s generally a good idea to take people who have visited our site and converted off of our remarketing list, because they have already done what we wanted them to do (and we don’t want to bug them). Under the Campaign exclusions dropdown, we’ll click the Interests & remarketing option. Then we’ll place our list of those who have converted in our exclusions. Again, to learn how to make a list like this, click here.
In our example, we’re targeting people who visited the Things by Bean site in the last week, but are excluding people who have already opted in to our emails or converted.
Making a Display Ad
To make a display ad, navigate to the Ads tab of your campaign and click the red +Ad button. You’ll then see your ad format options.
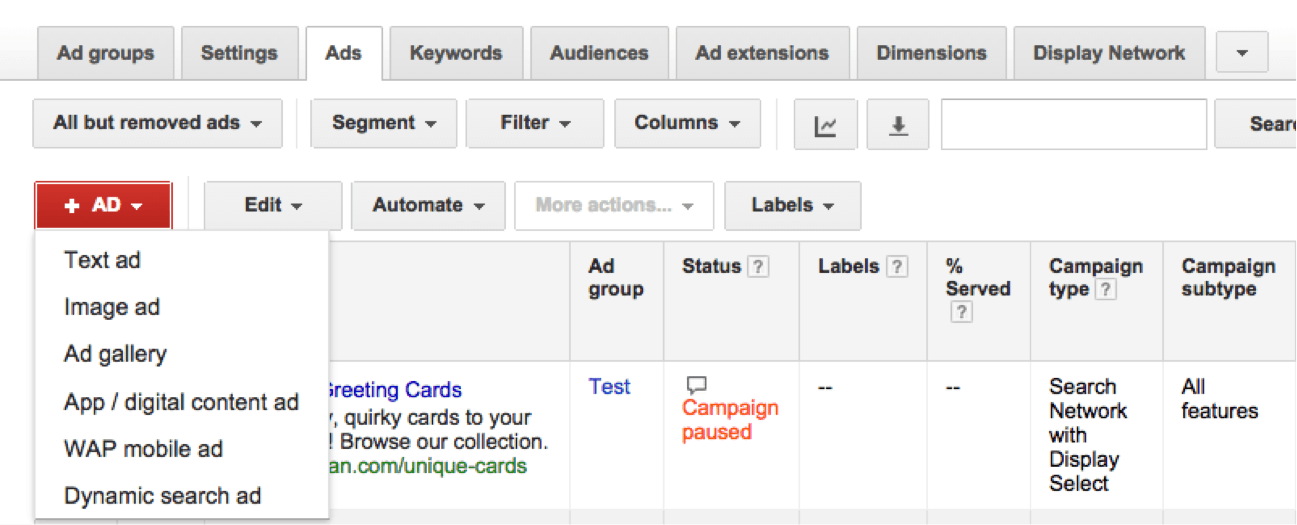
We went over the different types of ads earlier in the lesson. Here we’ll quickly review how to make an image ad. To find out more about the various types of ads, including tips for making them, visit this page from Google.
Once you’ve clicked Image ad, you’ll be prompted to either create an ad or upload one. If you already have an image ready, simply upload it. You can click Supported sizes and formats in the upload area to see available ad sizes and formats.
If not, click Create an ad. AdWords will then scan your site and generate ads for you to review and edit. You’ll be asked to enter your display and destination URLs.
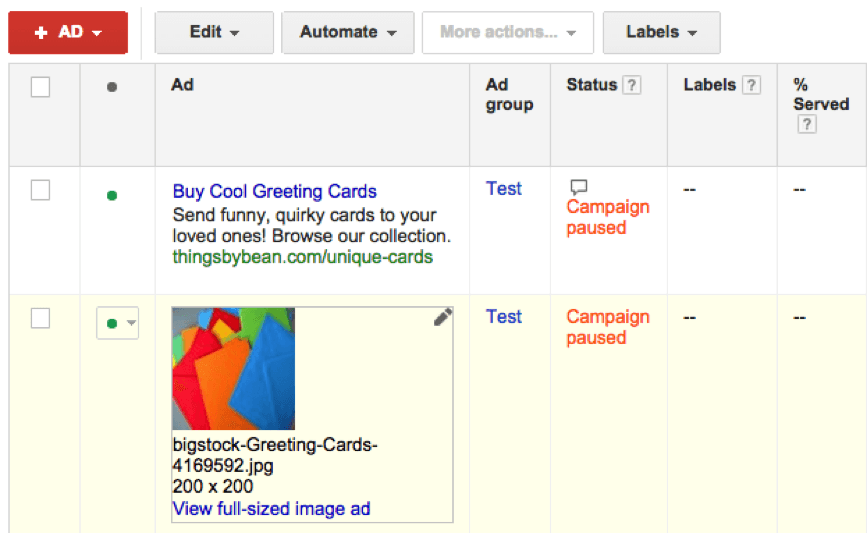
After you’ve uploaded or created your ad, click Save. Now when you select All ads in the drop down on the left side of the page, you should see a preview of your image ad. When you click on it, you should be taken to your destination URL.
If you need a little help making ads, select Ad gallery once you’ve clicked +Ad. This tool can help you make all kinds of ads, including videos, interactive, social and more. Just follow the outlined steps and use the what you see is what you get (WYSIWYG) editor to make your ad.
When you’re ready, re-activate your campaign!
Optimizing Ads
Take advantage of the ability to make engaging, illustrative ads. People enjoy looking at images, and the right picture can reinforce your message. Google has an extensive list of best practices for creating display ads.
Monitoring Display Ads
Reviewing display ad performance differs slightly from studying search ad performance. This reflects the distinction between their characteristics and goals. Since most display ads are not clicked, but are viewed and then encourage a user to convert at a later time, basing display ad performance on clicks isn’t the best.
With search ads, you optimize for clicks and emphasize a strong click through rate. For display ads, it’s better to focus on conversions and view through conversions (when an individual has seen a display ad and converts in the next 30 days). To learn more about monitoring and evaluating ad performance on the display network, look at this guide from Google.
Introduction

Why Web Tracking Is Important
Collecting unbiased, observational data about web users—what they click on, what they read, what they shared, etc.—is one of the first steps in improving a website.
Using the unbiased data you collect, you’re better able to identify what’s working and what isn’t working. Knowing that, you can build on what’s working and try to fix what isn’t working. Then, it all comes back to measuring the impact your changes made so that you can repeat successes and avoid failures.
Essentially, the importance of web tracking can be boiled down to this: If you’re making decisions without any data, you’re just guessing. Instead, you need to be making informed decisions that are supported by data you’ve collected.
What You’ll Walk Away With
By the end of this lesson, here’s what you should know:
- Ways to identify what needs to be tracked on a website
- What needs to be set up to track website activity
- How to audit a website’s tracking mechanisms
Defining Web Tracking
![]()
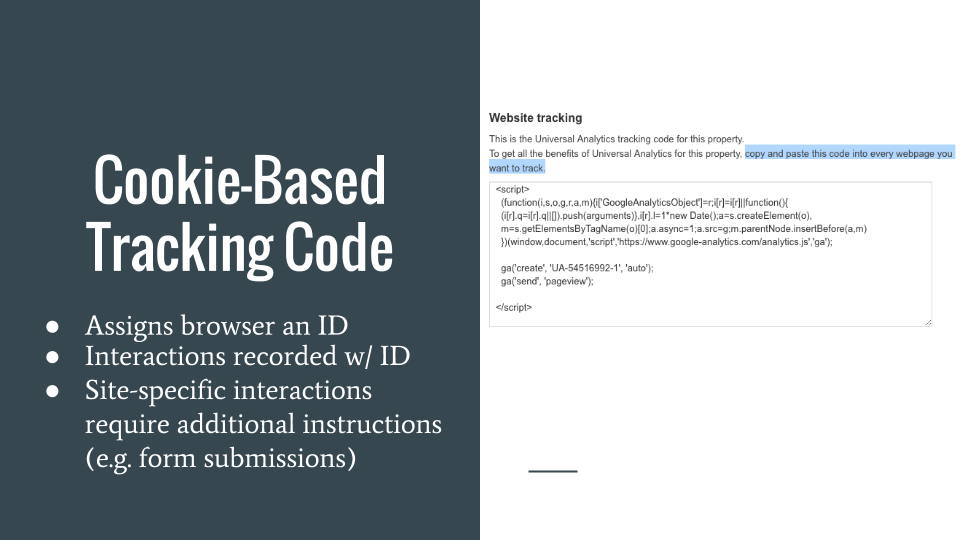
Web tracking is the collection and analysis of a visitor’s behavior on the web. The primary method for web tracking is with HTTP cookies that are interpreted by Google Analytics, Facebook, or other analytics platforms.
How To Track Web Users
This lesson uses Google Analytics for web tracking examples.
Why Google Analytics? Well, it’s most likely the analytics suite you’ll be using as a digital marketer — it’s free, it’s popular throughout the world, and it’s robust enough to track almost anything you want.
Don’t worry about walking away from this lesson with just system-specific knowledge. Most (if not all) of what we cover can easily be applied to other systems as they function very similarly.
Understanding What To Track
Know What Can and Should be Tracked
Consider a map. Maps are just visual reports of a bunch of measurements—distance, elevation, voting districts, etc. A mapmaker could cram virtually everything measurable into a map, but it would be unreadable and ultimately useless.
Digital marketers are like the mapmaker. You’re expected to identify important items on a website and measure the activity around them. You could try to measure every little thing on the website, but then you risk losing the important metrics amongst a data overload (and a very slow website). So, it’s best to keep things simple.
Fortunately, Google Analytics makes web tracking easy. By default, they automatically track a ton of critical data about your website. By simply installing the code, you’ll be able to see things like:
- Engagement: Pageviews, avg. time on page, exit rate, etc.
- Audience: Location, type of device, new or returning, etc.
- Acquisition: How they found the site, what referred them, etc.
What’s not automatically tracked are key elements that live on certain pages—contact forms, whitepaper downloads, etc—but we won’t get into how to track these things just yet.
For now, it’s just important to know that your analytics platform will provide you with an abundance of page-level data by default including who’s visiting what, from where, and when. Other important parts of your website (forms, downloads, etc.) will require manual tracking.
Connect Your Client’s Expectations With What You’re Tracking
Most clients you work with won’t give two hoots about the majority of the things tracked by Google Analytics. Bounce rate? Average time on site? Who cares!
Clients just want to see the money. So, working your way backwards from the sale, you need to identify all the important elements leading up to a purchase or a contact submission. Clients want leads, phone calls, downloads, walk-ins, purchases, and so on.
Resist the temptation to “dazzle” clients with all the data you have and stick with the stuff you know they care about.
We’ll talk in more detail about how to identify your client’s most important website interactions (calls, downloads, etc.) and what you need in order to track them in a later lesson on Event and Goal tracking.
Setting up Tracking
Install Google Analytics
Google Analytics provides you with an abundance of measurements to educate your efforts for improving a website. It’s also free to use, so it’s the analytics platform of choice for most websites.
You may want to consider installing Google Tag Manager if you don’t have easy-to-access edit abilities for the website’s code. There are also a great deal of other analytics platforms (e.g. HubSpot, Omniture, etc.) but they all have similar functionality.
We won’t go into detail on how to install Google Analytics in this lesson because that’s covered in the upcoming lesson Using Google Analytics.
For now, just know that choosing and installing an analytics platform is the first step to making informed marketing decisions. It allows you to efficiently gather the data you need to properly test, reproduce, and improve your website.
Implement Event Tracking
Google Analytics automatically tracks a ton of activity on your website, but it doesn’t capture all of it.
There are some parts of the website that you have to manually identify if you want it track them. That’s where Events come in to play.
Events allow you to track additional website activities, like:
- Clicks on buttons
- Form interactions
- Mouse commands
- Errors
- Plenty more
Events can also be used to trigger Goals—the things you want your website’s visitors to do. So, when you’re thinking of Events, consider them to be tiny milestones your visitors may pass through before they arrive at your Goals.
In a future lesson, Using Goal & Event Tracking, we’ll discuss how you can identify parts of your website that need event tracking and what you need to do to set them up.
Set Up Goals
Every website has a goal; whether it’s a purchase, a subscription, a share, or something else. Otherwise, that website wouldn’t exist.
Measuring how many and how often Goals are completed is a good indicator of a website’s success. So if you’re gonna keep your finger on the pulse of anything, goals should be it.
So, how do they work? Goals are commonly triggered by one of the two methods:
- A URL visit (e.g. www.brianthackston.com/thank-you-for-downloading-this-dragonload-of-viruses)
- An event firing (e.g. clicked on Twitter share button on blog post)
There are other ways to set up Goals, including amount of time spent on the site, but those types of engagement goals are mainly used for forums, journalistic endeavours, and non-business websites.
We’ll cover how you can enable Goal tracking in an upcoming lesson, Using Goal & Event Tracking. For now, just know that a Goal is the most important action your website visitors could do.
Enable Search Console and Sync Data
The analytics platform you use should import as many data sources as possible. After all, activity outside of your website can have just as much of an influence on success as things within your website. Seeing the full picture is invaluable.
One important source of tracked data is Webmaster Tools. Google Search Console tracks a bunch of diagnostic data for website—errors, pages crawled by search engines, sitemap indexability, etc. While most of the Search Console data is technical in nature, it still adds value for some creative marketing processes.
For example, you can use the Search Console keyword data for finding your popular keywords, the backlink report to find out who’s linking to you, and the warning messages to discover if Google penalized your website.
To set up Search Console, you have a few options.
- The easiest one just requires you to click “Verify” but that only works if you have the newest version of Google’s Analytics code on your website.
- Otherwise, you’ll have to use one of their alternate verification methods, which are described here (we suggest the HTML tag method—it’s quite easy).
Once set up, you’re then able to sync that data with your analytics platform. Doing so helps consolidate data offering insight into the user’s journey on your site. To enable the sync, you’ll need to do the following:
- Log into Search Console
- On the homepage, click on the dropdown for “Manage Site” and select “Google Analytics Property
- Choose the Google Analytics property that you want to sync the data with
Sync AdWords Data
AdWords is one of the biggest advertising networks around and we’ll talk more about it in a future lesson. For now, it’s important to know that you can and should import advertising data into your analytics platform.
Syncing your AdWords data with Google Analytics helps improve your understanding of online campaign effectiveness by showing deeper insights into user behavior. Rather than reproduce Google’s instructions for how to do this, I’ll just point you to Google’s support article for linking Analytics & AdWords.
Install the AdWords Conversion Pixel
AdWords has its own system for tracking conversions.
It works similarly to Google Analytics Goals, in that you can specify when a conversion takes place by URL (e.g. placing a conversion pixel on www.brianthackston.com/thank-you-for-downloading-this-dragonload-of-viruses).
Additionally, you can also track conversions from:
- Calls on-site
- Calls from call extensions
- Mobile application events
You can also import Goal data from Google Analytics into AdWords, but that tends to be slower to update, potentially negatively impacting your AdWords strategies.
Understand and Use UTM Tags
Tracking activity that came from 3rd party websites can be difficult. You don’t have any tools or platforms collecting that data for your use and asking the third party to share that data isn’t easy (different formats for different platforms and importing it isn’t always possible).
UTM tags on hyperlinks solves some of this problem. Tagging your links with UTMs allows you to pass extra pieces of information to your website whenever a user clicks the link on the 3rd party website.
For example, you can UTM tag your link on a third-party’s email newsletter with information about the link’s location on the page:
- i.e.—www.webmechanix.com/?utm_source=lukegracienewsletter&utm_medium=email&utm_content=top%20of%20email&utm_campaign=Email%20Sponsor
In the example above, your analytics platform would know that the visit was the result of a click on a link at the top of Luke Gracie’s newsletter email. You’d then be able to assess the value of visitors coming from that 3rd party source and determine whether the money and time you spent was worth it.
Consider Using Google Tag Manager
If making changes to your website’s code is difficult (layers of bureaucracy, security measures, etc.) then Google Tag Manager can take away some headache.
Google Tag Manager is a container placed on the website that houses all types of tracking code (Analytics, Webmaster Tools, AdWords Remarketing, etc.). Simply install it once on the site and then you can easily make changes to a wide variety of tracking codes through Tag Manager.
Tag Manager can be a bit more complicated when compared to simply installing the code you need directly on the pages, but sometimes you don’t have that luxury.
We’ll talk more about Tag Manager in a future lesson. For now, just know that it exists.
Auditing A Website’s Tracking
![]()
Below are some quick tips for auditing your website’s tracking. We’ll look at this more in-depth for Google Analytics in an upcoming lesson, Conducting A Google Analytics Audit.
Test your Analytics installation.
Things break. Things go wrong. That’s why it’s essential that you check and double-check to make sure all your installations are functioning properly—starting with Google Analytics.
To test your Analytics installation, you can use the Google Tag Assistant extension. After installing your tracking code, simply click on the extension and it will tell you if it’s working properly.
Note: If you have Google Analytics opt-out enabled in your browser (and you should to keep your data clean!) then Goals and Events will not fire. Disable it or test in a browser without the extension installed.
Alternatively, you can test your tracking code by running through any of the actions that trigger pageviews, Event/Goal completions, and any other tracking you have installed.
Verify Goals are Set Up and Firing
Tracking website goal completions is a fundamental part of digital strategy. Without Goals, it’s harder to trace what your most profitable digital activities have been.
To find out if your Analytics account has Goals set up, you need to do the following:
- Log into the Google Analytics profile
- Go to the “Admin” section
- Click on “Goals” under the section titled “View”
- Check to see if any Goals are set up, find out which ones are recording, and know what the criteria for a completion is
After you’ve determined your Goals are set up, you can test them out by submitting a test (e.g. filling out the tracked forms) and seeing if it registers.
You can also use Google Analytics built-in verification functionality on the Goal set up page, but that may be inaccurate if you’re testing an infrequently completed Goal.
Verify Goals are Monetized
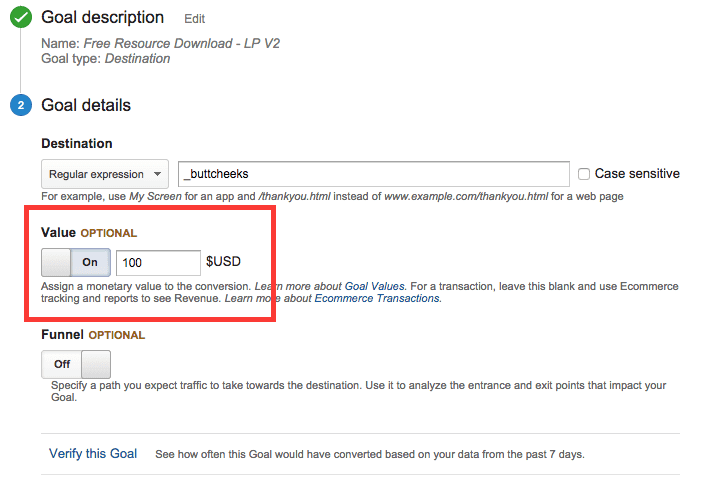
Assigning a monetary value to a goal completion can help you identify what your most profitable digital activities are.
To do monetized Goals, you simply need to include a Goal Value during setup. If your Goals are already set up, you can click into an existing Goal in the “Admin” section and add a value.
Remember, you don’t need the numbers to be exact—an estimation of the value of a completion will be enough to get a rough picture for what’s affecting your website’s ROI the most. But if you can figure out an accurate number with the help of your client, then that’ll be even better.
Ensure Events are Set Up and Firing
Events allow you to establish milestones your visitors will pass on their way to a completing a goal. Measuring those milestones can help you identify where users are struggling to convert.
You can find existing Events by looking at the “Events” reports found under “Behavior” in Google Analytics reporting.
If there aren’t any Events showing up in your Google Analytics reports, then that could mean:
- You don’t have any Events set up on your website
- The Events are set up but they’re not firing
- Nobody has triggered an Event yet
The best way to test Events is by completing the action they’re purportedly tracking and running the Event Tracking Tracker extension. It will tell you if the Event fires and whether there were any errors.
Check to See If AdWords Conversion Pixel Works
If you’re using AdWords Conversion Pixel to track goal completions, then you need to make sure it’s correctly firing.
The simplest way to test AdWords tracking would be to trigger your ad, click on it, and then trigger the conversion (e.g. submit a form). However, this way costs money and the tracking lags behind a bit.
The best way to verify AdWords tracking would be to inspect your website’s code and test it with Google’s Tag Assistant extension.
Here are the steps for testing with Tag Assistant:
- Navigate to the page where you’ve installed the tracking code.
- Right click on the page, click on “View Page Source”, and search for “Google Code for”. If the code is correctly installed, you’ll find it.
- Once you verify the code is installed, you can test it by clicking on your Tag Assistant extension.
Try This Tracking Exercise
Complete the exercise below before moving on. You’ll gain critical hands-on experience that will help you become the marketer you were meant to be. Plus, it makes completing the quiz at the end of the lesson even easier.
Exercise: Creating UTM Tags
![]()
UTM tags are one of the most basic types of web tracking you can do. In essence, it’s simply a way for you to organize your website data — by name of campaign, originating source of the traffic, keyword associated with that traffic, and the location within web content where the visitor found your hyperlink.

Lesson Goal
To explain how social media advertising works, how to plan social media ad campaigns, and tips for success.
The Difference Between Social Media Marketing and Advertising
Social media marketing is when a firm develops its own presence on social media networks, such as their own pages or profiles, and then posts content and updates to those profiles. The firm is not paying for the page or posts. With social media advertising, a firm pays to have their content or products promoted in a user’s feed or on the site when the user logs in.
Social media marketing is a pull strategy, in which users come to the company’s pages out of interest, whereas social media advertising is a push strategy, in which a company pays to appear where users will see them.
Creating a Plan
Before you jump into social media advertising you need to create a plan. First, you must determine what your goals and objectives. What do you hope to achieve? How will you keep track of your progress? When do you want to start seeing results? Then, decide who you plan to target, where you plan to target them, and how you’ll budget your efforts.
Finding a Target Audience
To increase the likelihood of campaign success and prevent costs from skyrocketing, develop a detailed profile of who your best customers are, and where they tend to be on social media. Think about what your consumers are interested in, how old they are, etc. Here are some quick statistics on the users of the most popular social media platforms.
| Platform | About Their Users |
|
|
|
|
|
|
|
Channel
In a previous lesson, we discussed matching your message to your channel. Remember to use visuals on Pinterest and Facebook, more informative messages on LinkedIn, and catchy headlines on Twitter. Refer back to that lesson for more ideas of what works on each social media network.
Budget
The cost of your ads will vary depending on which network you are using, how many individuals you are targeting, and how often your ads are showing. However, in general, social media ads are fairly cost effective, especially compared to more traditional channels.
Cost structures are similar to those we mentioned in our paid advertising lesson, and can include cost per click (CPC), cost per thousand impressions (CPM), or cost per action (CPA). The structure you choose should match your goals. Do you want to drive awareness? CPM might be best for you. Want people to click on your ad? Focus on CPC.
What Makes a Good Ad?
Social media ads have to stand out from a user’s friends’ photos, status updates, and other companies’ ads. However, you don’t want your ads to be intrusive–people aren’t logged into their social media accounts to look at your ads.
The elements of an ad will vary from network to network, but the following principles always apply.
- Include an interesting visual. Eyes naturally move to images, so it’s important to pick one that will not only capture attention, but also generate interest. Ensure that the image is relevant to your ad, that it could not be seen as offensive, and that it’s of a high quality.
- Use a headline that stops people in their tracks. A short, catchy headline that conveys the benefits of what you’re offering is ideal. Review our lesson on copywriting for more tips about writing headlines.
- Provide a preview. In the space where you can add information, provide a preview of what users will like about your product. The goal is to make them think that you have something they will want.
- Use clean URLS. The simpler your URL, the more trustworthy you appear. It might seem suspicious if Things by Bean sent users to thingsbybean.com/ad1/533432-jk-8hslkandi compared to thingsbybean.com/browse-cards.
- Allow for feedback and sharing. Let customers comment on your ads or share them with friends. This is a great opportunity to engage them further by answering questions or providing more information. Allowing them to share the ad with others can also increase your reach.
What to Avoid
Placing ads is fairly similar to posting content on social media. Ads should be clear, specific, and credible. For the best results, avoid the following.
- Harsh selling. As we mentioned, individuals aren’t on social media to look at your ads or shop. Encountering blunt messages that try to get them to buy can be irritating. Make sure to use a friendly approach in your ads that isn’t overly pushy.
- Odd formatting and spelling mistakes. Always double check your ads’ format before sending them live. Having weird spacing, ALL CAPS, misspellings, or strange punctuation can make your ad seem less legitimate and turn customers away.
- Misleading consumers. Make sure that your ad matches the landing page where you’ll be sending customers. If the ad mentions a free ebook, but the site page just mentions a free preview of the ebook, customers will feel like you intentionally misled them, and they’ll trust you less. Always ensure that your wording, appearance, and offer are the same between your ads and your site pages.
Why is Google Analytics Important?
You can use Google Analytics (often referred to as GA or analytics for short) to transform the raw data about your visitors and their movements on the site into easy to read, valuable information.
Using Google Analytics can help you understand what your users are interested in and where your site might need improvement, as well as spark ideas for new content or methods of engagement.
What You’ll Walk Away With
By the end of this lesson, you should be able to:
- Understand what Google Analytics is
- Navigate through the Google Analytics interface effectively
We’ll cover how to read the reports, how to track additional website elements, and other topics in future lessons. For now, you just need to know your way around the reporting suite.
What is Google Analytics?
Google Analytics is an online platform that allows site owners to track traffic to their site and visitors’ actions on the site. It can provide an overview of how your site is being used or be used to dig deeper for more detailed analysis.
Setting Up Google Analytics
Outfitting your website with Google Analytics tracking code is typically quite simple.
What you’ll need:
- The Google Account you want to use to manage the reporting
- Access to the backend of the website you want to track (i.e. where you can add content and alter code)
All set? The steps for setting up an Analytics account are as follows:
- Visit the Google Analytics home page and and sign-up or log into your existing account.
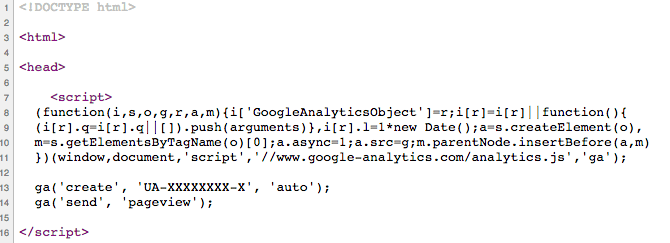
- Find your tracking code. If you’re setting up a new account it will be presented to you; if you have an existing account, it’s located in Admin –> Tracking Info –> Tracking Code.
- Your tracking code must then be placed on every page of the website you want to track, directly before the closing head tag (</head>).
- It’s a good idea to place the code within the site header so it will automatically be added to every page.
- Do not alter the code in any way, as this could break it and prevent it from reporting.
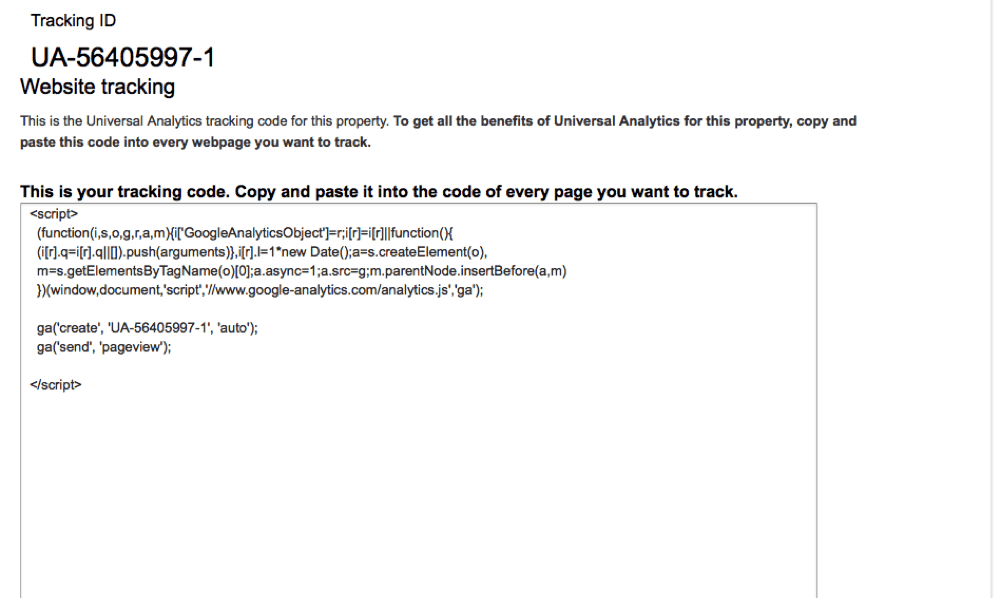
Once the tracking code has successfully been placed on the site, the Tracking Code page will show if the code is working properly.
Analytics is then ready to go! If you run into issues installing your code on your site, try using Google’s Tag Assistant extension. It will tell you what issues it’s encountering and link you to relevant articles to the fix the root cause.
Using Google Tag Manager
Google Tag Manager allows you to easily make changes to your website’s tracking code. Your web tracking codes are stored in containers, which can be easily installed sitewide and then be remotely modified.
Google Tag Manager containers also allow for easy bulk changes and implementations. If, for example, you wanted to add a specific tracking code on a number of pages, rather than manually adding it to each page, you can simply write a rule that only places the code on pages matching the rule’s criteria.
We’ll talk more about using Google Tag Manager in future lessons. For now, just know that it’s an alternative way to add tracking code to your website and can drastically reduce the amount of technical implementation time needed for adding or modifying web tracking codes.
The Interface
Your Analytics home screen lists the properties for which you have installed Analytics.
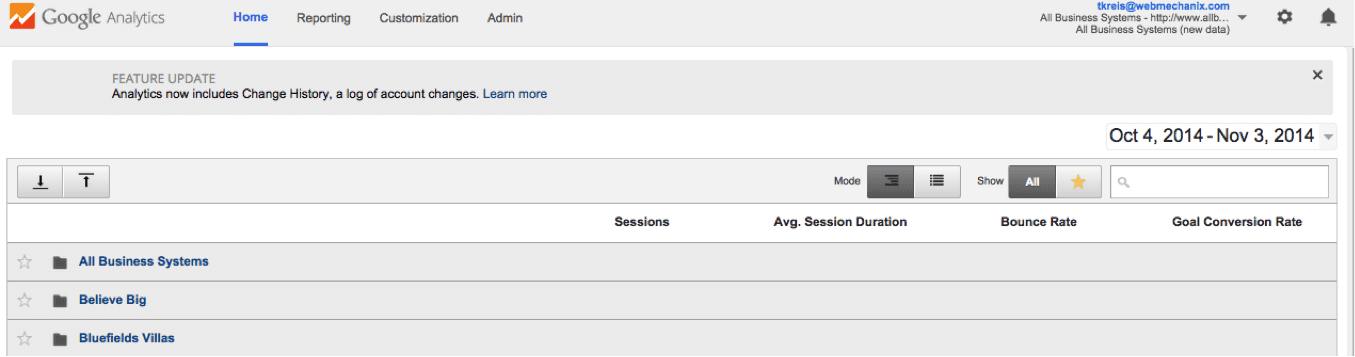
Each property can house multiple websites. For instance, if our greeting card company, Things by Bean, had a main website and a secondary website used at conventions and other events, both would be housed under a single Google Analytics property.
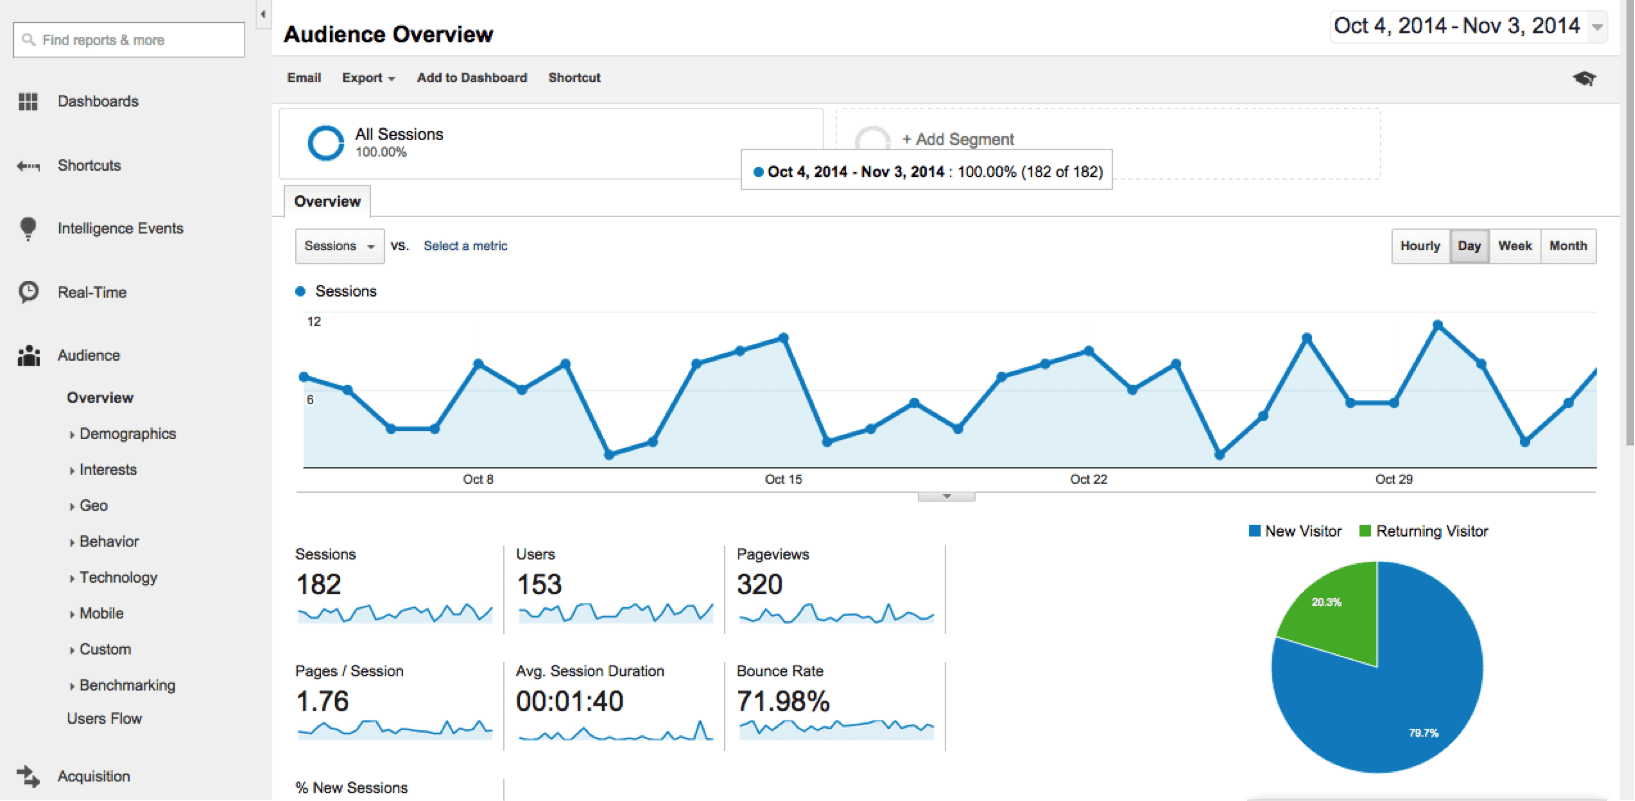
By default, Analytics opens to the Overview section of the Audience category. It shows basic information, including a graph of the sessions on your site over time and the number of users.
Date Ranges
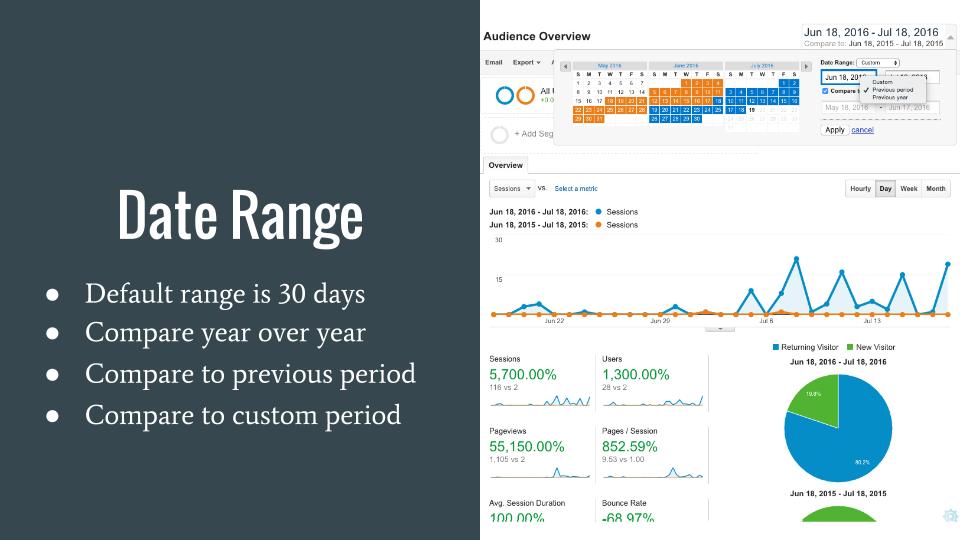
The default time range in Analytics is the previous month. You can set the date range by clicking on the dates shown in the upper right hand corner of the screen. You can also compare two separate time frames. To do so, check the Compare option and enter your second date range in the provided fields.
Analytics should stay on that date range throughout your session. However, it’s a good idea to double check that your date ranges are consistent as you navigate through Analytics, as different date ranges will deliver different data sets.
Dimensions and Metrics
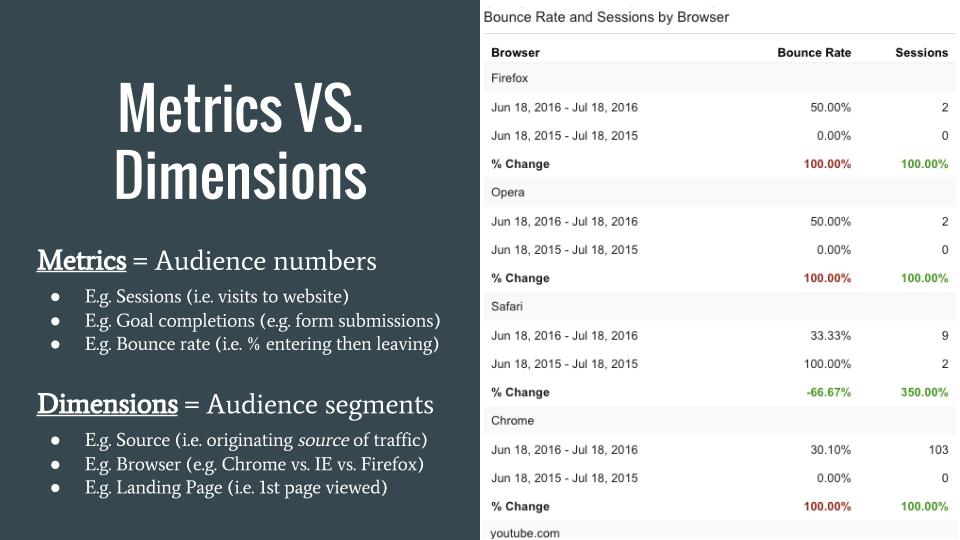
Dimensions and metrics will be covered more extensively in another lesson, but it’s valuable to know about these elements as you make your way through Analytics.
A dimension is a category such as browser type or page title. A metric, on the other hand, is how those dimensions are measured. For example, if we wanted to see how many visitors came to our site using Firefox, the dimension would be browser type, and the metric would be the number of visitors.
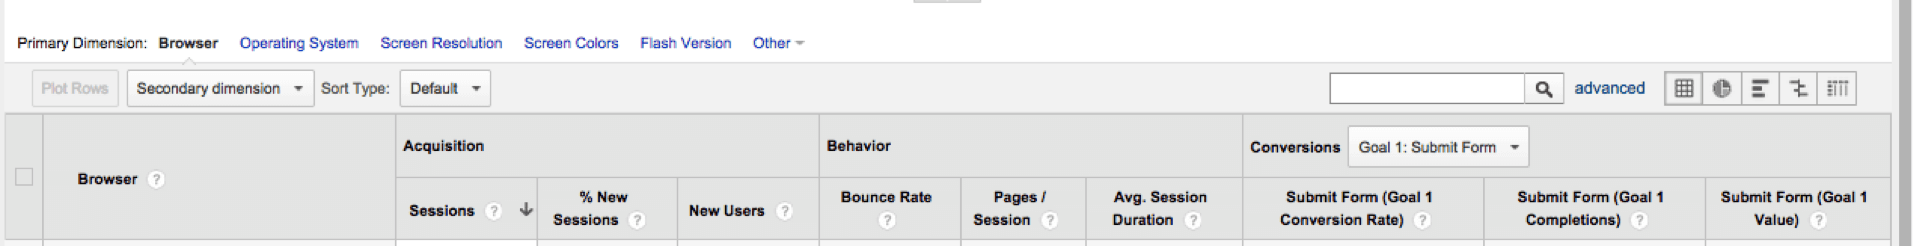
You can use dimensions to filter your data in any section of Analytics. This option can be found below the graph of the information and above the data table.
The Four Major Sidebar Sections
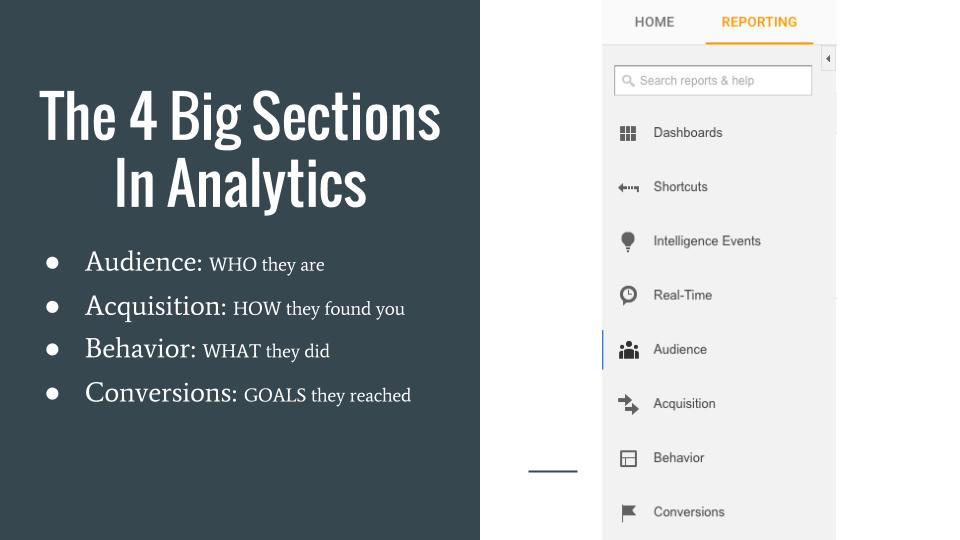
The left side of the page contains several sections and most of your navigation will be done here. The first four options are Dashboards, Shortcuts, Intelligence Events, and Real Time.
We’ll discuss how to use these sections in our more advanced Google Analytics lessons.
For now, we’ll be talking about the next four sections found on the sidebar and the types of data they contain in Analytics.
The four major sections of Google Analytics navigation are:
Audience
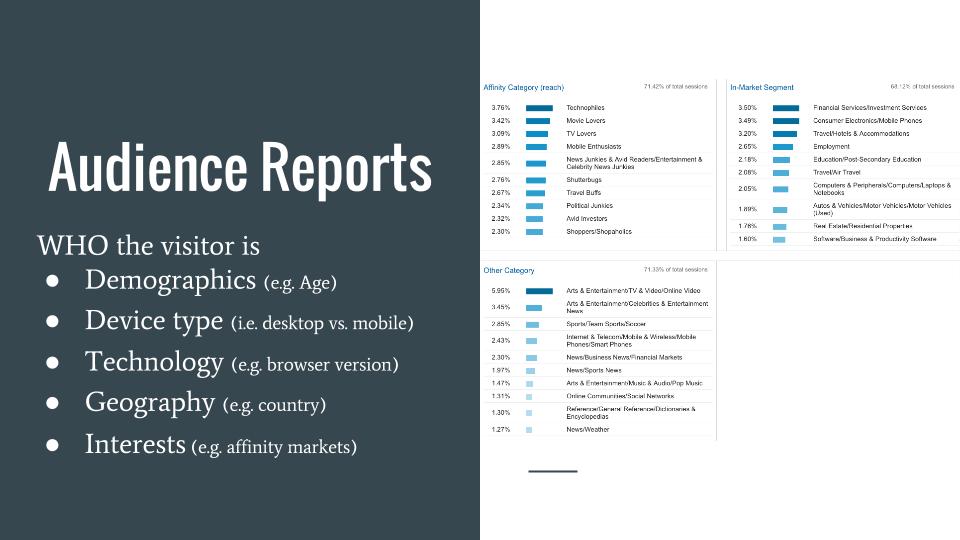
You can find information about who your visitors are in the Audience tab in the sidebar.
We’ll only be discussing a few of the subsections in the Audience reports for this lesson. If you’d like more information about one of these sections, you can click on it in the table to learn more from Google’s help articles, linked below.
Audience Overview
The Audience Overview section provides general data about the users on your site, such as how many users have visited the site, the language they speak, and how many of them are first time versus returning visitors.
Geo
The Geo category includes information on the language spoken by site visitors and their geographic location. Clicking on either sub option will bring you to a more detailed page.
Behavior
Here’s what you’ll find in each sub tab of the Behavior section of the Audience category:
| Subtab | Data Shown |
| New vs. Returning | How these different types of users interact with the site, for example:
|
| Frequency and Recency |
|
| Engagement | A more visual representation of:
|
Technology
The Technology section of the Audience tab includes data on two topics:
- Browser & OS: See which Internet browsers visitors are using to access your site and their operating system (ie. if they have a Mac or a PC)
- Network: See which Internet provider your users have
Mobile
Under the Mobile sub tab of the Audience section are Overview and Devices options.
- Overview: Presents the breakdown of users who accessed the site via a desktop/laptop, mobile phone, or tablet.
- Devices: Provides more detailed information about the machines visitors used when they accessed the site, such as if they were using an iPhone or Samsung Galaxy.
Users Flow
This tab displays a flowchart that illustrates users’ movements throughout the site. This can provide insight into their thought processes and reveal behavior patterns.
Acquisition
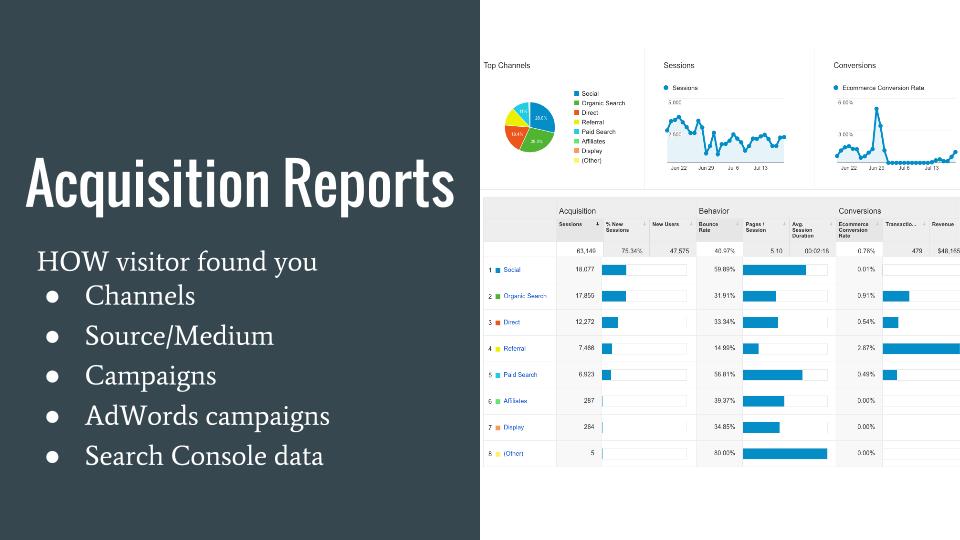
The Acquisition section focuses on how users came to your site. For example, you can see if they found you on Google or through another site.
Most of the commonly used subsections for this category are listed below. We won’t be talking about every subsection in this lesson, so as before, you can read more on Google’s Analytics support site, linked below.
Acquisition Overview
The Acquisition Overview provides a visual snapshot of how users have reached your site. Graphs show the number of sessions over time as well as the distribution of the channels used to find the site.
All Traffic Channels
Channels are the different avenues through which a user can access a site. For example, if you click on a link to a site in Facebook, you would have taken a social channel to get to the site. This tab breaks down how many visitors utilized each channel. Channels include:
- Direct: A user types the exact URL into the address bar
- Organic Search: A user conducts a search on a search engine like Google and they clicked on the result that represented your site
- Referral: A user clicks on a link to your site from another website
- Paid Search: A user clicks on a pay per click advertisement that leads to your site
- Social: A user clicks on a link to your site that was on social media
All Referrals
This section provides detailed information on the traffic to your site that came from referrals. You can see which site individuals came from, and how many people came from that site.
AdWords Campaigns
This section allows you to link to your AdWords account to get more detailed information on visits that were a result of clicking on a PPC ad.
Queries
This tab shows you which queries, i.e. keywords, visitors typed into a search engine that have brought up your site as a result. Hopefully you find that the user clicked through to your site, believing it was a good result that was relevant to their query.
Social Overview
The Social section shows how social media sources have contributed to your site’s traffic. It includes the following:
- Overview: A brief overview of how social networks impact site traffic
- Network Referrals: A breakdown of which social media networks have led to visits to your site, how many visitors, and how engaged those users were
- Landing Pages: Information about user engagement and the number of sessions on the pages visitors landed on when coming from a social media network
- Conversions: Displays the number of conversions from visitors coming to your site from social media
- Plugins: Provides a summary of which content is being “Liked” or “+1” etc.
- Users Flow: A flowchart illustrating the movements of users from social media
Behavior
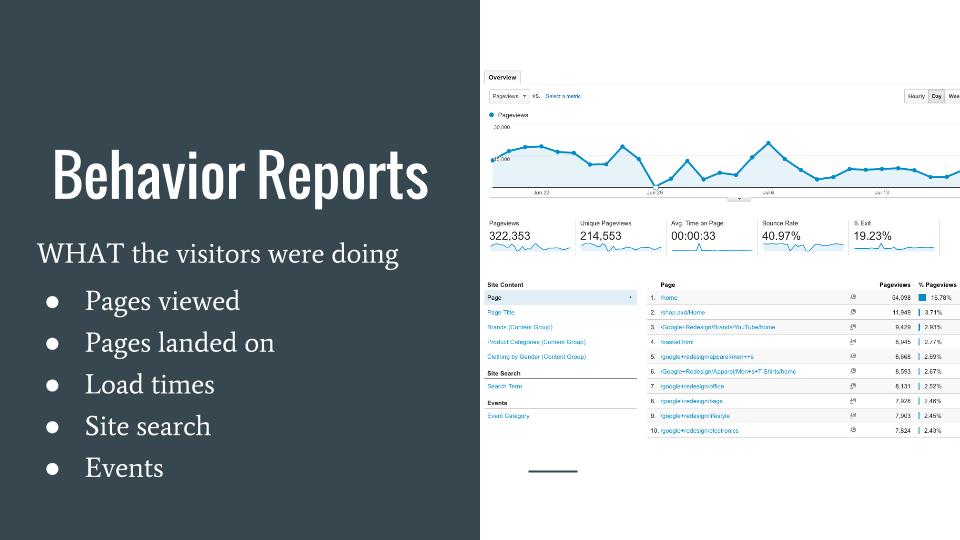
The Behavior section of Analytics provides insight into what your visitors are doing while they are on your site. It includes the following subcategories:
Behavior Overview
The Behavior Overview gives a quick glimpse of how many page views your site is getting, the average amount of time spent on a page, and the bounce and exit rates, etc.
Behavior Flow
Much like the User Flow section in the Audience tab, the Behavior Flow illustrates how users are navigating through the site.
Site Content
The Site Content tab provides the opportunity to dig into the specific data for each page of your site. There are four subsections, including:
- All Pages: Shows pageviews, average amount of time spent, entrances, bounce rates, and exit percentages for each web page. You can toggle between the page URL and the Page Title in the bar above the data table to make the data easier to organize.

- Content Drilldown: Differs from the All Pages tab in that it allows you to compare sections of a website rather than just the individual pages.
- Landing Pages: Provides information on the pages where visitors enter your site. You can find session and engagement information for your landing pages here, as well as goal conversions and completions.
- Exit Pages: Shows the pages from which your visitors leave your site. This data can reveal which pages might need to be revamped to keep users on your website.
Site Speed
This section shows how fast your web pages are loading in comparison to your site’s average, and also provides suggestions to improve load times.
Site Search
The Site Search tab summarizes what users have typed into your website’s search bar, which requires some set-up to track. It has three reporting subsections.
- Usage: Compares the number of visits that did and did not include a search.
- Search Terms: Shows exactly what visitors typed into your site search bar. This information can point to potential improvements for a better user experience.
- Pages: Shows on which pages searches are conducted. Seeing from which pages users are conducting searches can guide your content creation and ensure that all desired information is found on the appropriate page.
Events
Events are specific actions your users complete while they are on your site. You can configure an event to “fire” when a visitor clicks a particular button, submits a form, etc. This section shows you where events are being completed, which occur the most often, and the path users took before they triggered an event.
Conversions
This tab includes four subsections. In these reports, you’ll find out which website objectives your visitors are completing and how they’re being completed.
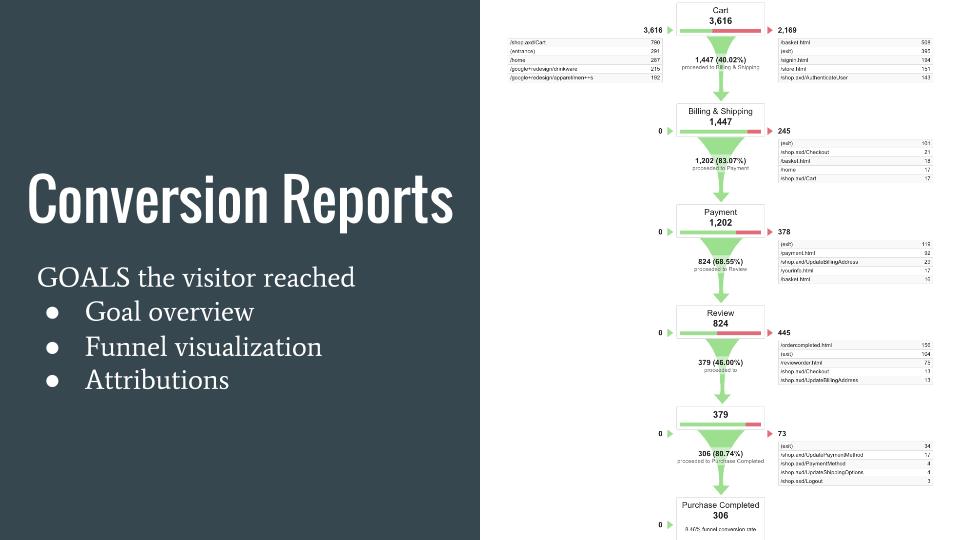
Goals
The Goals tab has five subsections. We’ll briefly describe the most valuable.
- Goals: Displays the URL for the pages you have identified as a signal to Analytics that a goal has been completed. Note that you have to set up goals for Analytics to track them. We’ll show you how to do this in a future lesson.
- Reverse Goal Path: Shows which pages visitors went to before they completed a goal, giving you an idea of what might have spurred them to complete a goal.
- Funnel Visualization: Highlights the number of users in each step of the funnel. You must have created a funnel to see data. A funnel is a sequence of pages that lead your visitor to complete a goal. To learn more about Funnel Visualization, you can visit this page by LunaMetrics.
- Goal Flow: Similar to Funnel Visualization, but the steps of a Goal Flow are not defined as they are in a funnel. To see the major differences between the two, check out this table from Google.
Multi-Channel Funnels
This section shows how users might see a combination of website referrals, social media mentions, and email campaigns before converting. Since we can’t tell which channel led to the conversion, we can attribute this conversion to the combination of all three. Google’s instructional video provides insight into using the Multi-Channel Funnel functionality.
The Four Tabs at the Top of the Page
Let’s move away from the left sidebar to the tabs at the top of the page. The four tabs are:
- Home
- Reporting
- Customization
- Admin
The Reporting tab is where you’ll spend most of your time, but it’s good to know what you’ll find in the other tabs as well.

Home
The Home tab is where you’ll find your list of properties and the websites associated with them.
Reporting
Here is where you interact with and view the data associated with the property you selected in the Home tab. The left sidebar contains all of the reporting sections that we just covered in this lesson.
Customization
In the Customization tab you can make your own custom reports. We’ll teach you how to build custom reports in an upcoming lesson.
Admin
The final tab at the top of the page is the Admin tab. Here you can change user settings, set up filters, find your tracking code, and more.
Accounts, Properties, and Views
The Admin tab is divided into three sections which define the account structure in Analytics.
- Account: The highest level in Analytics and what lets you access the tool. An account can have multiple properties.
- Property: Essentially, your website. A property can have multiple views.
- View: Different perspectives on or collections of data.
Confused? We’ll use our go-to example to help clear things up.
Our Account would be our company, Online Academy. Properties would include any websites we have, such as thingsbybean.com, and if we have other sites like info.thingsbybean.com. Then, within each property we could have multiple views, such as a view that filters out visits to our site from within our store and one that does not.
So our example could look like this:
Things by Bean (Account) → thingsbybean.com (Property) → All Website Data (View)
Google has an extensive explanation of this account structure here.
Goals
We’ve discussed that goals are actions we want visitors to take while they are on our site (and we’ll discuss Goals & Events again in greater depth in upcoming lessons). You can set up goals in the Admin tab, under the View section.
Here’s what you have to do to make a goal:
- Click the red “+New Goal” button on the left side of the page.
- Name and design your goal. The name should be descriptive so you can easily remember what that goal is.
- Select the type of goal you want to make.
- Fill in the required information.
There are several types of goals that align with different actions users can take on a site.
- Destination Goals: Refer to when a user visits a particular page.
- Duration Goals: Refer to when a user has spent a specific amount of time on a page or site.
- Pages/Screens per Session Goals: Refer to when a user has viewed a certain number of pages on the site.
- Event Goals: Refer to when a user has taken a specific action, such as clicking a “Contact Us” button. An event must be setup before you can make an event goal.
Note that you can only have 20 goals per view and goals cannot be deleted. If you need more goals, you’ll need to create another view or edit an existing goal.
Filters
Filters allow you to place limitations on the data you’ll see in Analytics. This means you can ignore actions you don’t want to include in your data, or focus only on the ones you do want.
For example, if we didn’t want to include our own visits to our company site from our physical store, we could filter out our store’s IP address. With this filter, any of the actions we take on our site at our own store won’t be included in our data, so we won’t skew our own results.
Try These Tracking Exercises
Complete the exercises below before moving on. You’ll gain critical hands-on experience that will help you become the marketer you were meant to be. Plus, it makes completing the quiz at the end of the lesson even easier.
Exercise A: Reading Google Analytics
Effectively reading Google Analytics’ reports comes down to asking yourself a few questions:
- Where did the traffic come from (e.g. search, social, etc.)?
- Where did the traffic go (e.g. homepage, service page, blog post, etc.)?
- What did the traffic do (e.g. purchased, bounced, viewed more pages, etc.)?
So by looking at your sources for the traffic and analyzing their behavior, you can start pinpointing the exact marketing effort that made the impact.
Exercise B: Troubleshooting GA Installation
Google Analytics installation process is fairly easy — you add one small snippet of code in a site-wide element and it begins collecting data.
However, technical peculiarities about your website and other innocent errors can create problems during installation. But thanks to Google’s Tag Assistant, identifying those issues is easier than ever.
Lesson Goal
By the end of this lesson you should know:
- How to set goals for Facebook ads
- Facebook’s ad campaign structure
- How to create an ad campaign
- How to monitor and report on performance
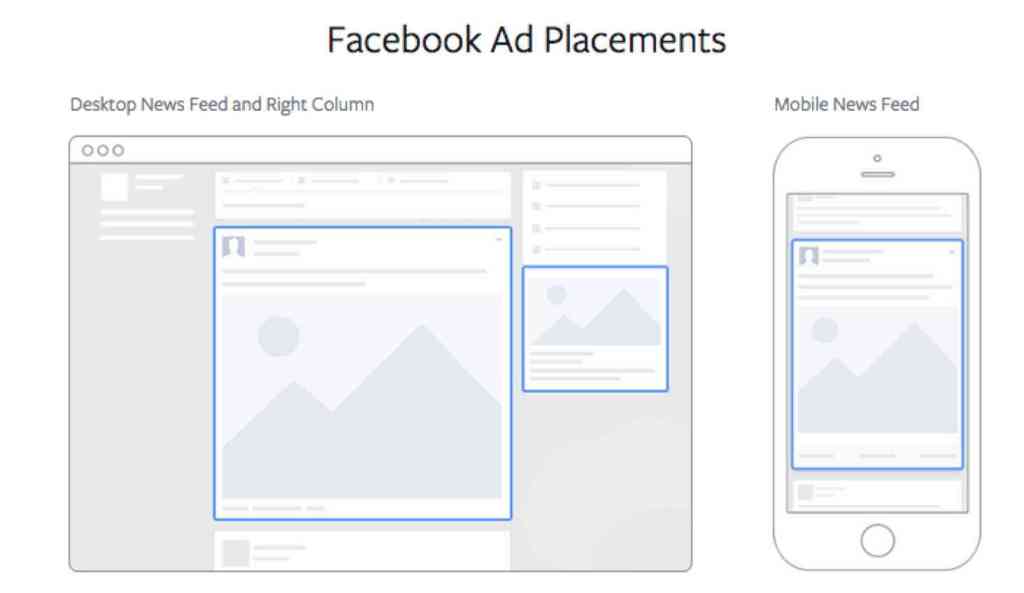
About Facebook Ads
Facebook ads can be highly targeted to ensure you’re reaching the best set of potential customers. They can appear in an individual’s newsfeed, on the right side of the page, or Facebook’s mobile feed.
Ads can also show individuals if their friends have interacted with your business.
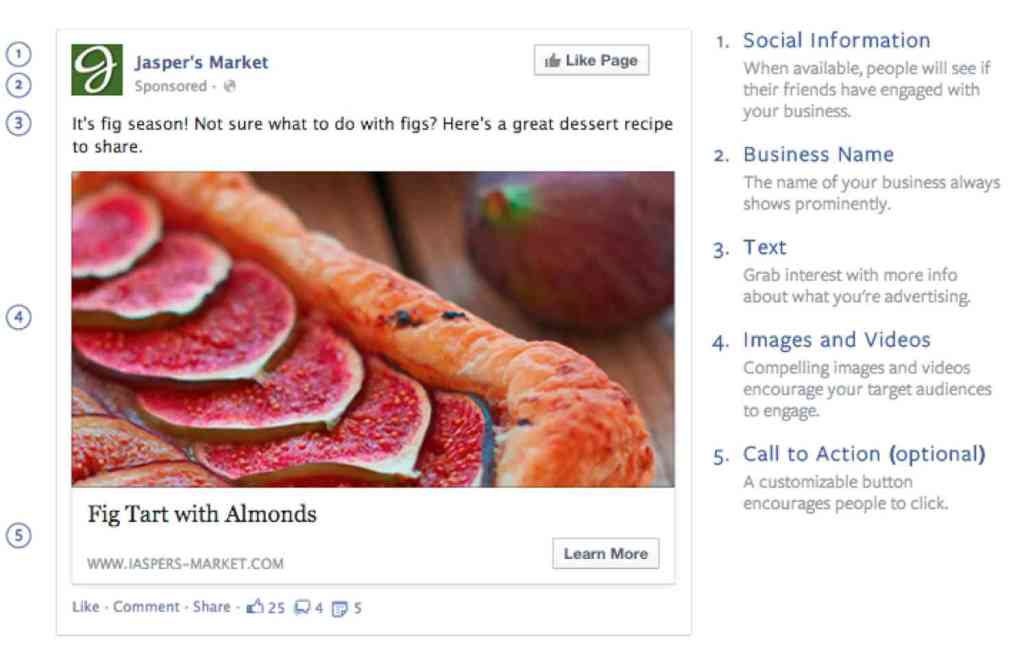
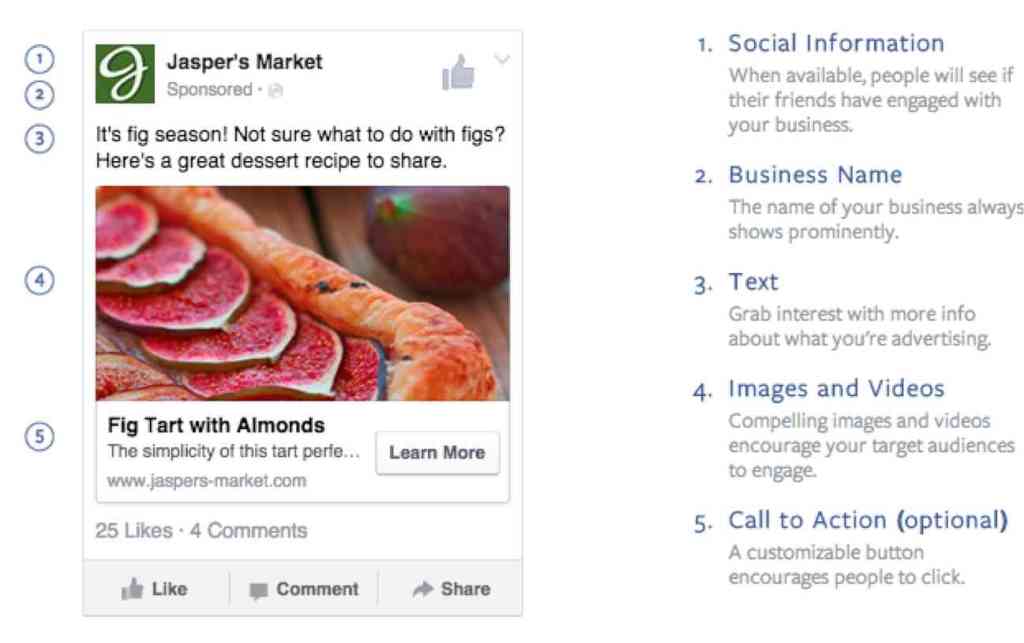
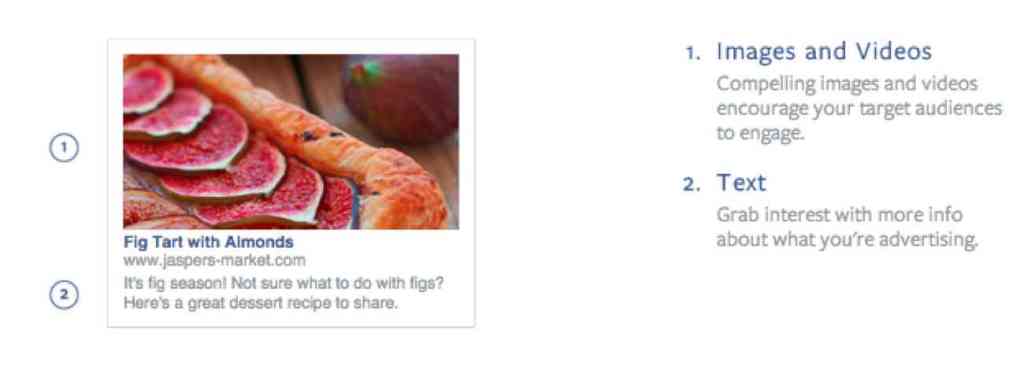
Elements of Ads
What is included in a Facebook ad depends on its placement. Desktop and mobile newsfeed ads include the following:
- Your business name
- If their friends have interacted with you
- Images or videos
- Description text
- A call to action
A desktop newsfeed ad:
A mobile newsfeed ad:
Ads appearing in the right column of Facebook are smaller and only include images and videos, and your text. Here’s an example of a column ad:
Setting Goals in Facebook
There are several goals an ad can accomplish on Facebook:
- Getting customers to interact with you on your Facebook page or event
- Getting visitors to go to or interact with your website
- Note that for this goal, you will also need to create a Facebook conversion pixel for your site.
- Getting users to download or use your app
We’re going to focus on the first two types of goals.
Campaign Structure
Facebook’s ad campaign structure is somewhat similar to that of AdWords. Its highest level is campaign, which contain ad sets (like adgroups), which contain ads. Here’s the diagram Facebook provides:
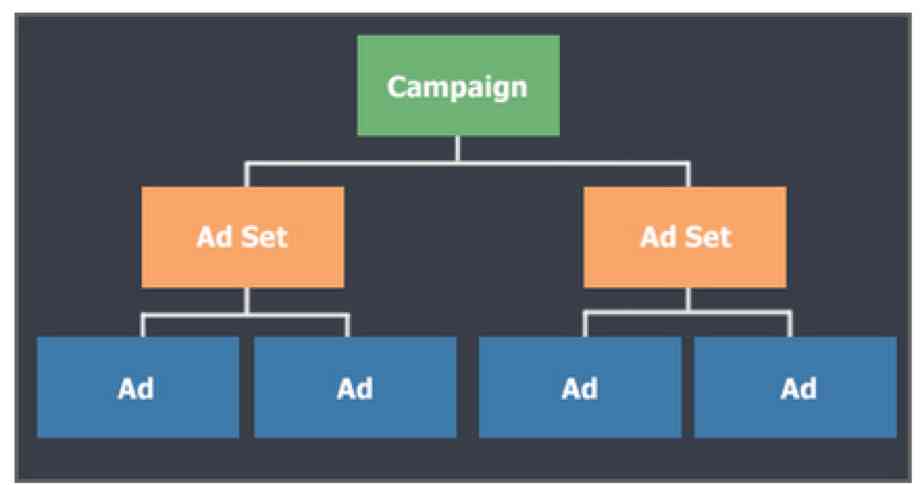
- Campaigns. Objectives are set at the campaign level in Facebook. Each campaign must have an advertising objective, and can not have more than one objective.
- Ad sets. Targeting options, scheduling, placements, budget, and bidding settings are all set at this level.
- Ads. These are the actual advertisements that can contain images, videos, and text.
Creating an Ad
Now we’ll walk through making an ad in Facebook, explaining your options as we go. For this example, we’re going to make an ad for Things by Bean’s Christmas cards.
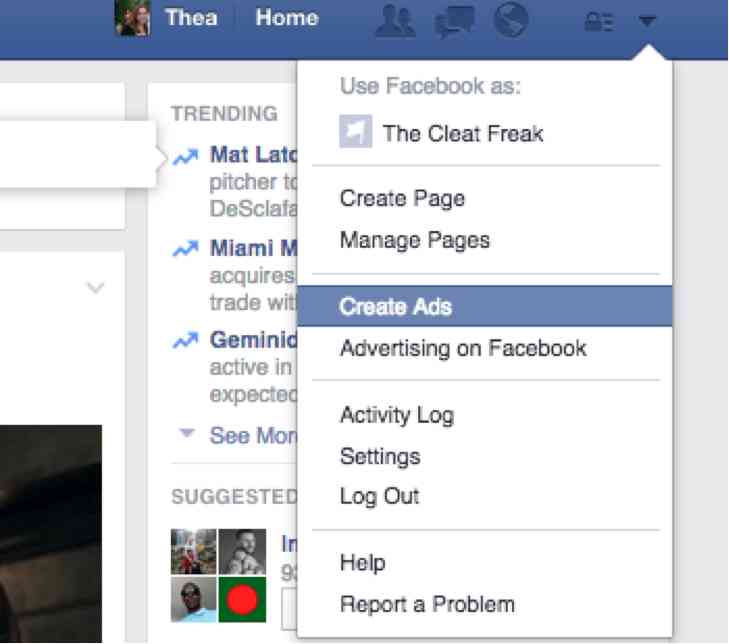
- Log in to Facebook with your company account. Click the drop down arrow in the upper right hand corner of the page, and select Create Ads. Note that you don’t actually need a business page to create ads on Facebook.
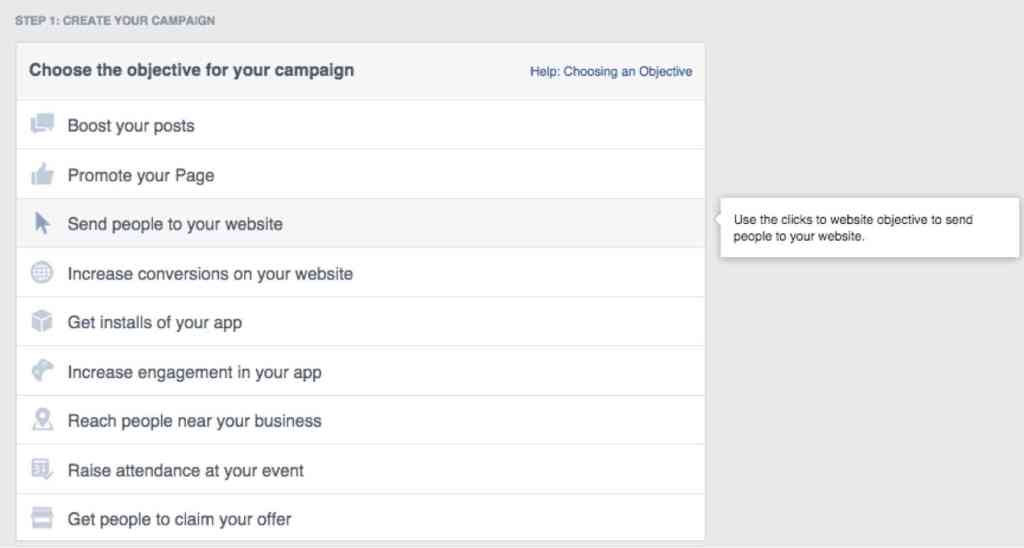
- Then choose the objective for your campaign. The options are explained in plain language. For our Things by Bean example, we’re going to set our objective to Send People to Your Website. Then we’ll be instructed to enter the URL for the site we want to promote, in this case thingsbybean.com/christmas
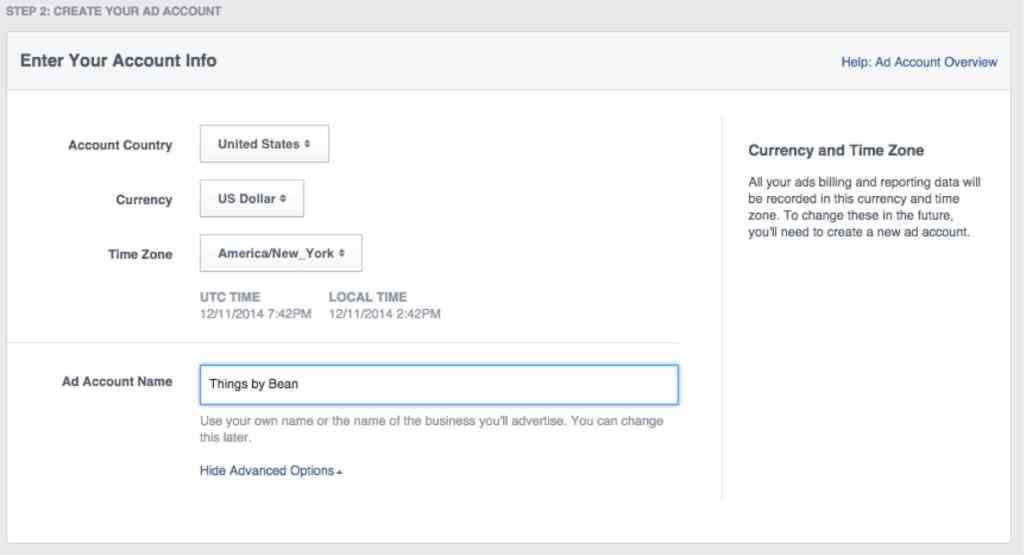
- We then name our campaign, enter our location and currency information, and finally, our account name (Things by Bean).
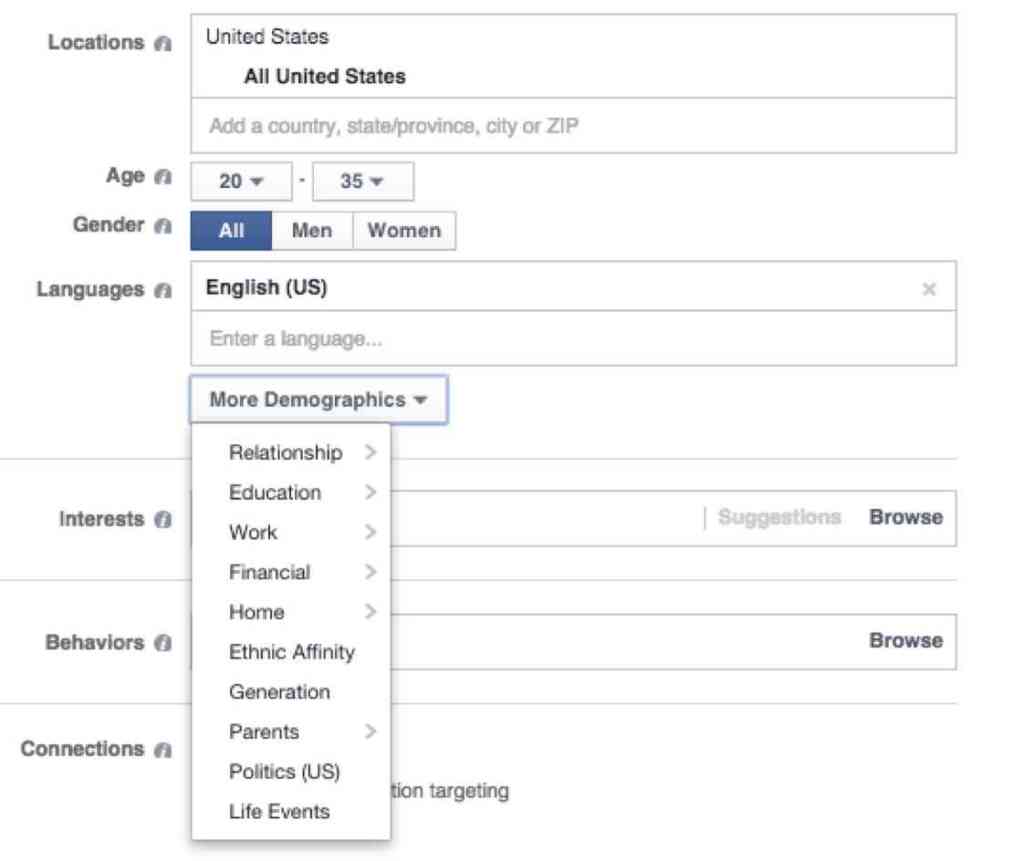
- Next, we choose our targeting options. We want to enter as much information as possible to have our ads shown only to those we think will be really interested in our cards. We’ll target the US, those aged 20-35, and both men and women. We’ll target only those who speak English. There are many more options for demographics we can explore, which are shown in the dropdown menu below.
- Now we’ll focus on limiting our audience based on their interests and behaviors. Targeting based on these parameters is often more successful than targeting based on demographics because you understand more about the customer.
We can choose from predefined options, or search. We’ll target people who are interested in family and friendship, Hallmark, greeting, and Christmas cards.
We do the same thing for behaviors. We’re going to target Trendy Homemakers, Shoppers, those who like entertaining, those who exhibit above average spending and shop online. We’re also going to target those who have purchased gift products, specialty foods and gifts. We’ll leave the connections setting to all, as we want to reach all qualified individuals, and not just those who are already connected to our page in some way.
Facebook keeps track of our settings and tells us how many people we could reach.
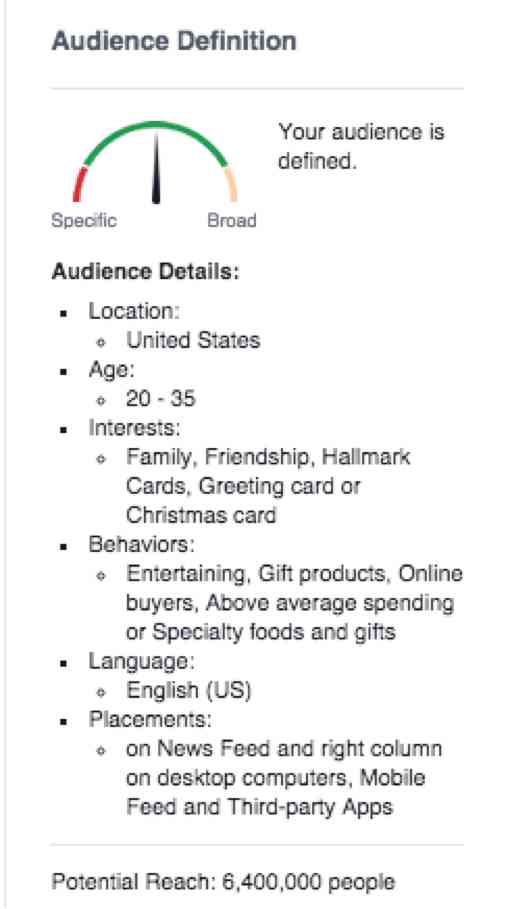
This is a very large reach. However, since it is our first campaign and we don’t have much insight about who will come to our site from social media, this is ok. As we get more information, we can further refine our campaigns. Typically a smaller, very targeted reach is best.
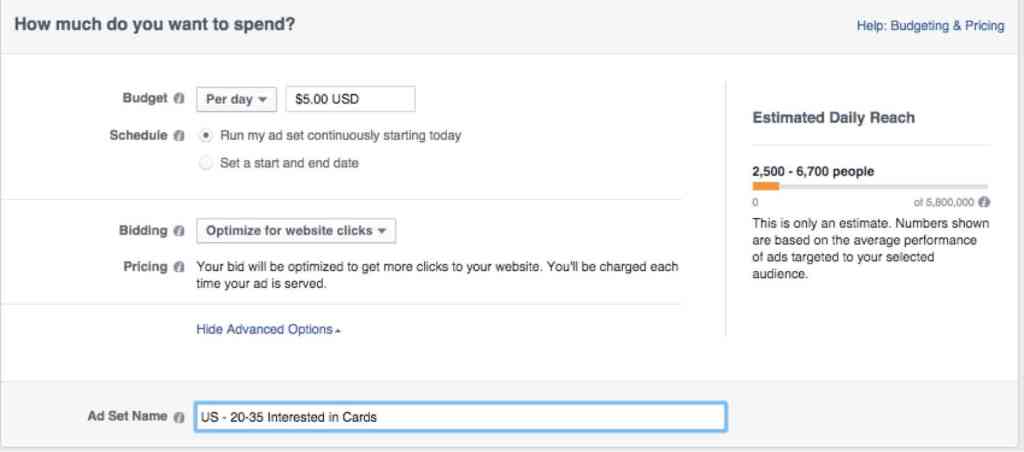
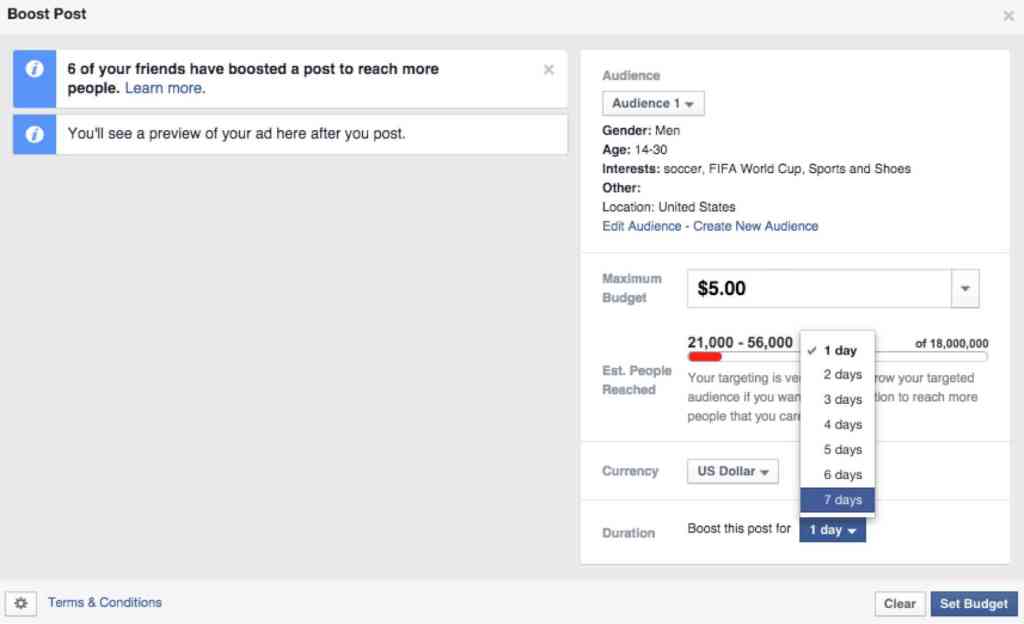
- Next we set our budget. We’re going to keep it small at $5.00 per day, and we’ll have it run continuously. You can also choose to set a lifetime budget, which is the maximum you’ll spend to run your ad set, as well as select starting and ending dates and times for your ad.
Facebook automatically sets our bidding strategy based on our objective. You can see this under Advanced Options in this section. We’ll add Interested in Cards to the ad set name Facebook created to make it easier for us to remember what sets this group apart. With our budget, Facebook estimates that we’ll reach at least 2,500 people per day.
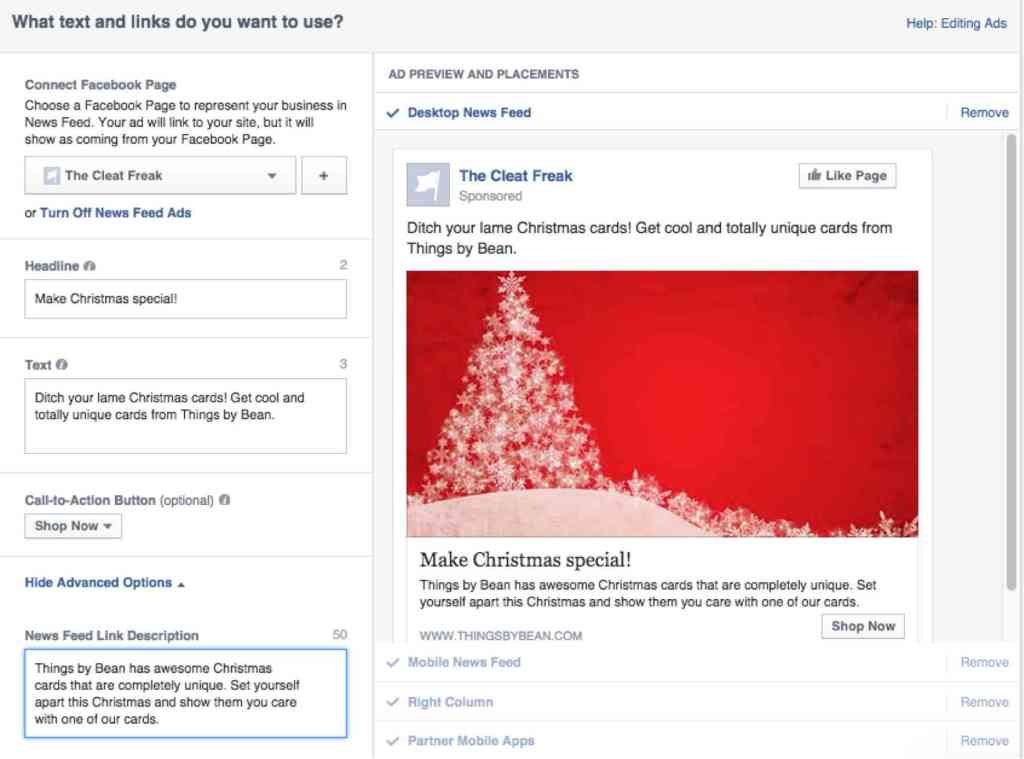
- It’s time to actually make our ad. Facebook makes it easy by allowing us to simply upload an image or search for one we can use from Shutterstock. Each image we select will create a different variation of our ad. Next, we decide which text and URL we want included.
We have 25 characters for our headline. Let’s use. Make Christmas special. You have 90 characters for your text above your image, and 200 for the text that appears below your image, if you click Advanced Options. You can also select a call to action button. Note that adding a button might cut off some of the text below your image.
A live preview of your ad as it would appear in each placement type will be shown on the right side of the page. If you don’t want a specific placement type, just click Remove.
- When you’re happy with your ad, click Place order. You’ll be prompted to add your billing info then.
Boosting Posts
An alternative to advertisements is boosted posts. A boosted post is a post you’ve written on your page that you’ve paid to have show higher up in people’s newsfeeds, so they’re more likely to view it. These posts also have the word Sponsored on them, and will not appear in the right hand column.
To boost a post, simply click Boost Post after you’ve written what you want to say. You’ll then have to option to select whom you want to target, and how much you want to spend on boosting the post. You can boost a post for up to 1 week.
Note that you can’t delete a boosted post after you’ve sent it live. You’ll first have to unboost it, edit it, and then reboost it.
Creating Offers
If your page has at least 50 likes, you can create offers for your page. An offer can be a discount or other promotion that users can redeem in-store or online. These offers will appear in users’ newsfeeds.
To create an offer, you can click Offer at the top of your page timeline, or navigate to the ads creation tool and select Offer claims as your objective.
You’ll then enter your headline, description text, and image for your offer. You’ll also have to choose an expiration date, and a limit for the number of claims. Click More Options to enter a start date, the URL where the offer can be redeemed (if the offer is online), and the redemption code. Add any applicable terms and conditions, and then click Create Offer.
You can create an ad to promote your offer, or boost your offer. Facebook explains how on this page. To see how many people have redeemed the offer, go to your Page Insights.
Monitoring Performance
Once you have ads up and running, you’ll be able to monitor their performance with Ads Manager. This video shows you how to access and navigate Facebook Ads Manager. Ads Manager lets you stop campaigns and ads, edit the budget and schedule of existing ad sets, and more.
Judge performance based on your campaign objectives. If your objective was to get people to click through to your site, you should focus on that number. Check in on your Facebook ads every week or so to see how they’re performing and check that everything is running smoothly.
Page Performance
If you just want to see how your page is doing, you can look at Page Insights, which will provide metrics on engagement, likes, and the reach of your posts. You’ll see Page Insights at the top of your page only after 30 people have liked your page.
Boosted Post Performance
You can see the number of unique visitors who have seen a boosted post on the post. To see how many of them saw it organically or through an ad, hover over this number. For more details, you can go to your Ads Manager or Page Insights.
Reporting
Facebook’s Ad Manager also offers the ability to create reports. Once you’re in the Ads Manager, click Reports. A default report showing general metrics will show. You can customize which columns are included by clicking Customize columns. To change the date range, simply navigate to the date and select the starting and ending dates for the data you want to see in your report. Like in AdWords and Google Analytics, you can apply filters to limit which data you see.
When you’ve organized your report, you can export it as an Excel or CSV file by clicking the blue Export button toward the top of the page. You also have the option to schedule reports, which will be emailed to specific email addresses on a daily, weekly, or monthly basis. To do so, click Schedule toward the top of the page.
For more information on reporting in Facebook, visit their help page.
