

Lesson Goal
By the end of this lesson, you should:
- Know about the different types of ads available on Twitter
- Understand the types of campaigns
- Know the various targeting options
- Be able to create and monitor an ad campaign
Types of Twitter Ads
There are three major types of ads available on Twitter. Each ad type is labeled as promoted in users’ feeds so they can tell the difference between ads and non-paid activities.
- Promoted Tweets. A Tweet that has been targeted toward a specific audience. Promoted Tweets can reach a larger group of people and include both your current followers and other users. There are a variety of design options including the ability to feature images or video. Promoted Tweets are the least expensive advertising option.
- Promoted Accounts. Involves having your account appear as a suggested account to follow to potential consumers. Promoting accounts is slightly more expensive than promoting Tweets.
- Promoted Trends. A promoted trend appears at the top of users’ Trending Topics module on the left side of their page. They come at a premium price–up to $200,000 for the top spot for just 24 hours! They also require a Twitter Ads Account Manager.
Since Promoted Trends are so expensive, we’ll focus on created promoted Tweets and promoted accounts.
Who Sees Your Ads
Twitter uses members’ activity and registration information to determine which ads to show them. It also uses information provided from ad partners, such as browser cookies and hashed email addresses (not sure what a hashed email address is? Check out this article from ClickZ).
It is valuable to note that users have the ability to avoid tailored ads by selecting a specific setting in their account. However, it doesn’t seem like many users actually take advantage of this setting.
Campaign Types
Twitter has two basic ad campaign types:
- Objective-based. Objective-based campaigns allow you to select the goal of your campaign. This impacts how you go through the campaign setup process, and what your campaign will look like. You are only charged for actions that match your objective.
- Custom. With this type of campaign, you are charged per engagement, such as if a user retweets, favorites, replies to, or clicks on your ad. However, you tend to be charged less per engagement.
It’s generally a good idea to use an objective-based campaign because these campaigns are built specifically to help you achieve your desired goals, and Twitter does the work of creating a streamlined setup process.
Objective-based Campaign Types
There are five types of objective-based campaigns. Each focuses on helping you achieve a different goal.
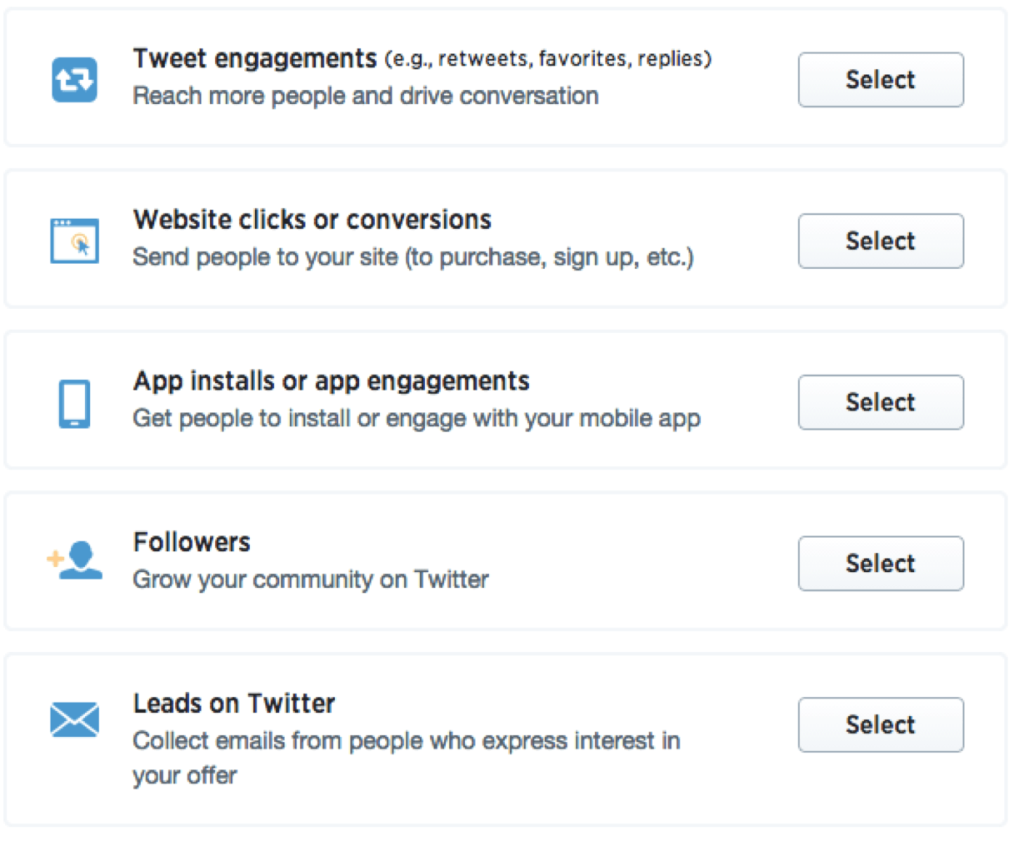
- Followers. This campaign type is meant to increase the number of people who follow your account. You will only be charged for new followers you gather during that campaign. You won’t be charged for Tweet engagements or clicks to your website. This type of campaign promotes your account.
- Website clicks or conversions. With this style of campaign, your goal is to either increase clicks through to your website, or gain conversions on your site. You’ll only be charged for these actions. Individual Tweets will be promoted, rather than your entire account.
To set up a clicks or conversions campaign, you must place a snippet of code on the page of your site associated with conversion (like a Thank You page) so Twitter can record data. Note: you won’t be able to see the option to create this tag unless you’ve entered your billing information.
- Tweet engagements. With Tweet engagement campaigns, you create promoted tweets with the goal of getting Retweets, replies, favorites, etc. You can promote a Tweet that will only be seen by your followers, or you can have your promoted Tweet shown to a specific target audience. You will only be charged for these actions, and won’t be charged for impressions.
- App installs or engagements. This campaign involves trying to get users to either install or open a mobile app. You’ll be charged only when someone installs an app or opens the app from your promoted Tweet.
- Leads on Twitter. The goal of a Leads campaign is to collect email addresses from users who are interested in what you have to offer. They can share their email addresses with you straight from your promoted Tweet. Again, you’ll only pay for leads you acquire.
Targeting Options
Twitter ads give you targeting options based on the following:
| Demographics-such as age and gender. | Interests -including specific categories like writing and comedy, as well as parenting and arts and crafts. |
| Location-down to the regional level. | Device-such as iOS or Android, mobile or desktop. |
| Keywords-exactly like with AdWords campaigns. Several match types allowing you to target Tweets, hashtags, usernames, or searches. | Usernames- targets users who are similar to those whose usernames you have entered. |
| Remarketing-targets users who have visited your site recently. | Tailored Audiences-Uses your own lists of emails, Twitter IDs, those who have visited your site, or those who have used your app. |
| TV based-use individuals’ interaction with a TV show or genre to promote related Tweets. |
The options available to you will depend on the type of campaign you select. To learn more about Twitter ad targeting, visit their help page.
Twitter Cards
Twitter cards add pizazz to your Tweets by including images, video, or other features beyond plain text, beneath a Tweet. Some require that you install a snippet of code on your site. You’ll be able to create lead generation, app, and website cards without installing code. To learn more, about using code for Twitter cards, click here.
Different Twitter cards are used for different campaigns. There are a total of eight styles of Twitter cards:
- Lead generation. A lead generation card includes an image and a call to action where users can enter their name, email address, and Twitter handle.
- Photo. This card type will add an image to your Tweet.
- Gallery. A gallery card is a photo card that shows up to 4 images.
- App. An app card includes an image and button that will bring users to a page where they can download your app.
- Player. This type of card is meant for displaying videos, GIFs, and music.
- Product. These cards include an image and 200 characters to provide information about your product.
- Website. A website card includes an image, link, and button. They’re great for trying to get users to visit your site.
- Summary. This type of card can be used as a preview of web content and includes a thumbnail.
The Top Four Menus
At the top of your Twitter ads page are four menus. You’ll only be able see the Campaigns menu until you add your billing information.
- Creatives. There are two options under the Creatives tab: Tweets and Cards. Tweets is where you can see your promoted Tweets and account campaigns, and any scheduled Tweets. The Cards option is where you can see any Twitter Cards you have created.
- Analytics. The Analytics tab includes a breakdown of data on Tweet activity, Followers, and Twitter cards. Once you select the option you’d like, you’ll see relevant metrics. For example, in the Tweet activity option, you’ll see the number of impressions, engagements, and any replies to your promoted Tweets.
- Tools. The Tools tab has three options: Audience Manager, App Manager, and Conversion Tracking.
- The Audience Manager is where you can see data on your tailored audiences and change settings.
- In the App Manager, you can set up tracking and advertising efforts for apps.
- Conversion tracking shows the status of conversion codes you’ve created as well as their settings. If you click Edit next to the conversion tracking code, you can see a copy of the code you need to paste on your site and adjust the settings.
Creating an Ad
Now we’ll walk through how to create an ad. Twitter makes the process fairly simple. You’ll need to log in to ads.twitter.com with your Twitter user name and password. For our example, our goal is to increase the number of followers for our Things by Bean account.
- First, decide on a campaign objective, or if you’d like to run a custom campaign. In this example, our objective will be to gain new followers, so we’ll create a Followers campaign. Once you’ve chosen one, Twitter will show you a preview of where your ad will be displayed and how it will be optimized.
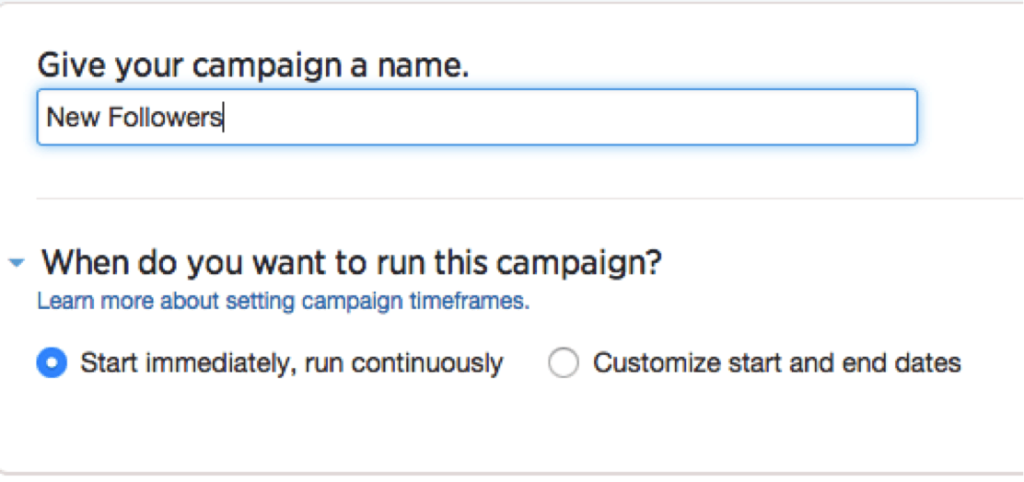
- Next, name the campaign. We’ll name our campaign New Followers. You can also choose to set start and end dates or run the campaign continuously. We’re going to run the campaign continuously.
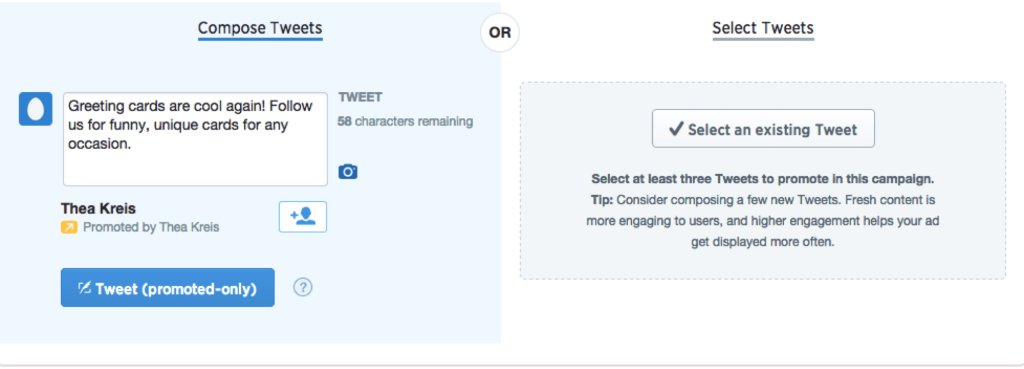
- Then, write 3 or 4 new Tweets or pick existing Tweets. These Tweets will be used to help promote your account.
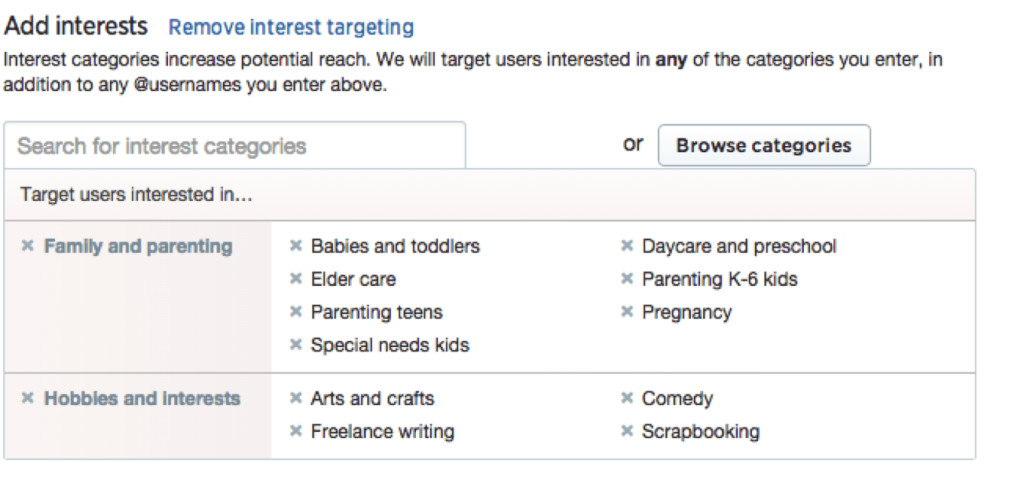
- Next we choose our targeting options. We will target the US, both genders, all devices and platforms, those with interest in family and specific hobbies (shown in image).
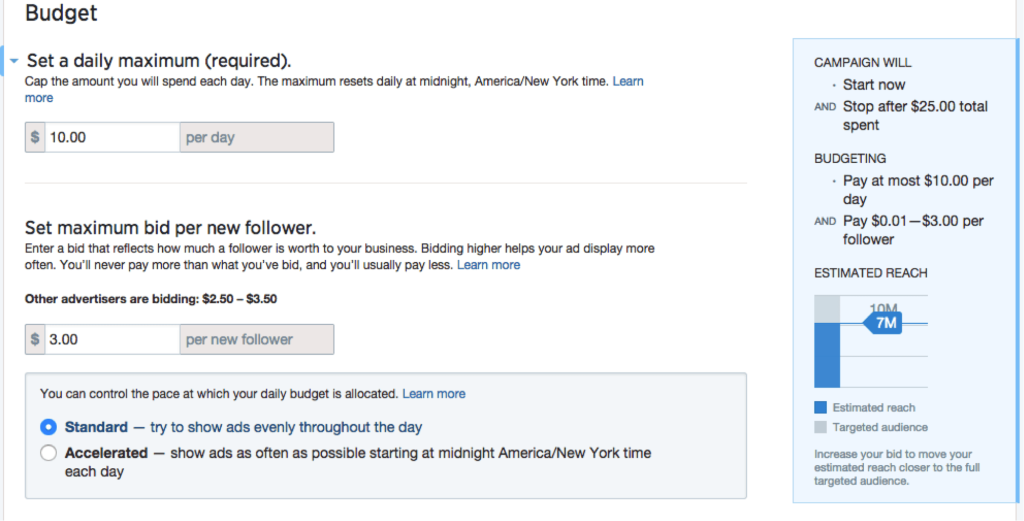
- Now we set our max budget per day and max budget per follower, as well as if we want our ads to be shown throughout the day evenly, or at accelerated pace. We also establish total budget for campaign to ensure that we don’t overspend.
We’ll set our max daily budget to $10, our max bid per new follower to $3, and have our ads shown evenly throughout the day to ensure that we won’t miss those who log in toward the end of the day (at least until we know which times are most profitable for us).
- Finally, we launch the campaign or save it as a draft. To edit the ad, we would go to our Campaign Dashboard (ads.twitter.com and log in). Then we’d click Edit next to the appropriate campaign.
Monitoring Performance
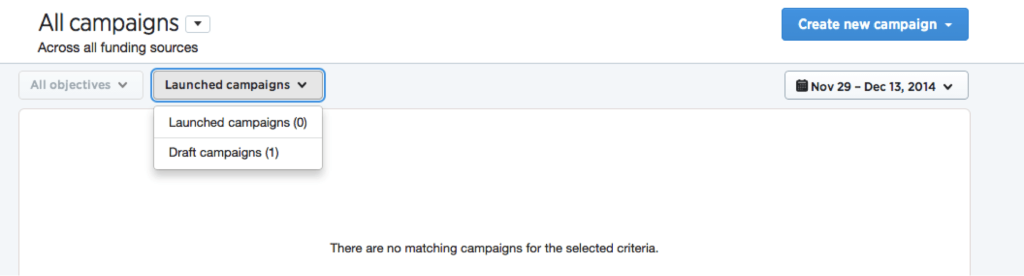
To see how your Twitter ads are doing, visit your dashboard, at ads.twitter.com. You’ll then be able to see which campaigns you’ve launched. You can also see any campaigns you’ve saved as a draft by selecting Draft campaigns from the menu toward the top of the page.
You can review Tweet, follower, and Twitter card analytics in the Analytics tab at the top of the page.

Clicking on any of these options will bring you to a more detailed view of data. For example, here’s what a Tweet activity analytics dashboard looks like:
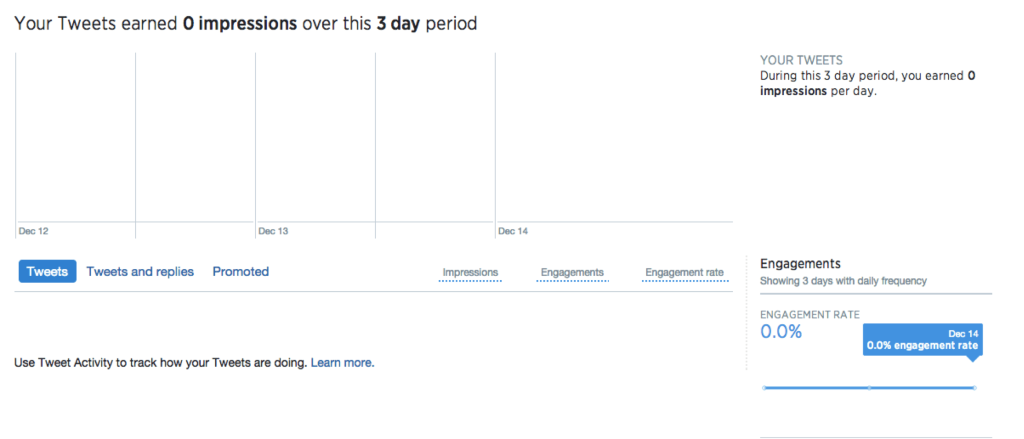
Scrolling down the page you’ll see information on the number of times your links have been clicked, as well as the number of Retweets, favorites, and replies.

Why is Google Analytics Important?
You can use Google Analytics (often referred to as GA or analytics for short) to transform the raw data about your visitors and their movements on the site into easy to read, valuable information.
Using Google Analytics can help you understand what your users are interested in and where your site might need improvement, as well as spark ideas for new content or methods of engagement.
What You’ll Walk Away With
By the end of this lesson, you should be able to:
- Understand what Google Analytics is
- Navigate through the Google Analytics interface effectively
We’ll cover how to read the reports, how to track additional website elements, and other topics in future lessons. For now, you just need to know your way around the reporting suite.
What is Google Analytics?
Google Analytics is an online platform that allows site owners to track traffic to their site and visitors’ actions on the site. It can provide an overview of how your site is being used or be used to dig deeper for more detailed analysis.
Setting Up Google Analytics
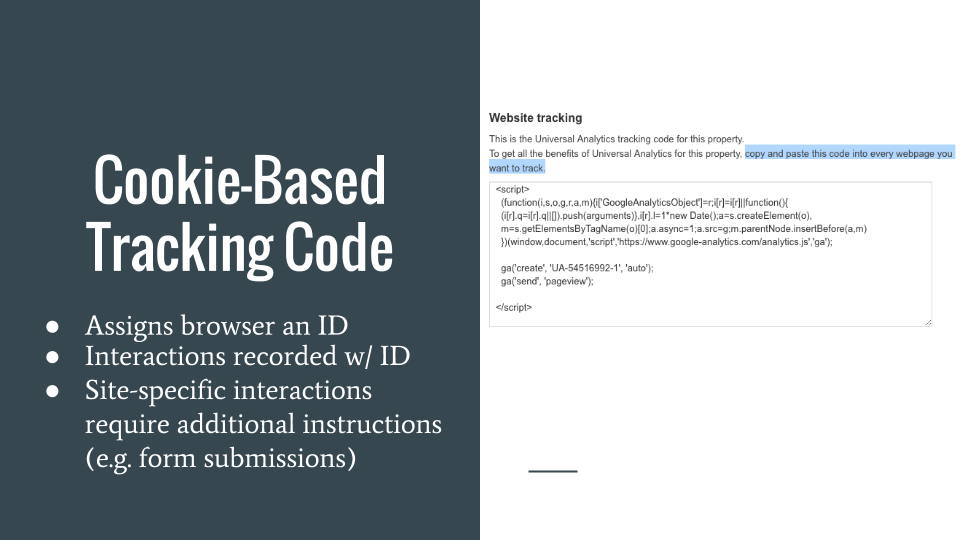
Outfitting your website with Google Analytics tracking code is typically quite simple.
What you’ll need:
- The Google Account you want to use to manage the reporting
- Access to the backend of the website you want to track (i.e. where you can add content and alter code)
All set? The steps for setting up an Analytics account are as follows:
- Visit the Google Analytics home page and and sign-up or log into your existing account.
- Find your tracking code. If you’re setting up a new account it will be presented to you; if you have an existing account, it’s located in Admin –> Tracking Info –> Tracking Code.
- Your tracking code must then be placed on every page of the website you want to track, directly before the closing head tag (</head>).
- It’s a good idea to place the code within the site header so it will automatically be added to every page.
- Do not alter the code in any way, as this could break it and prevent it from reporting.
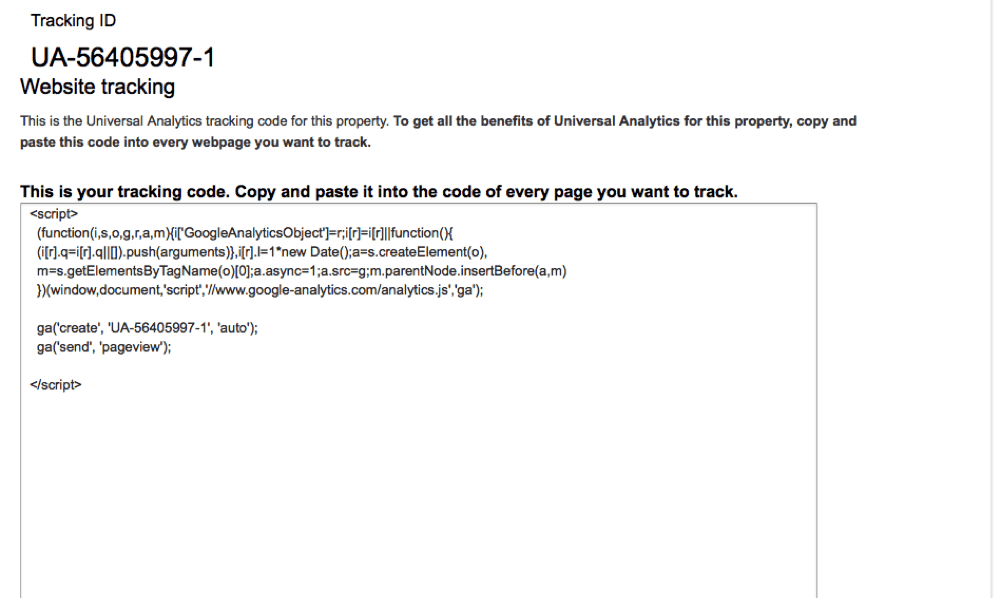
Once the tracking code has successfully been placed on the site, the Tracking Code page will show if the code is working properly.
Analytics is then ready to go! If you run into issues installing your code on your site, try using Google’s Tag Assistant extension. It will tell you what issues it’s encountering and link you to relevant articles to the fix the root cause.
Using Google Tag Manager
Google Tag Manager allows you to easily make changes to your website’s tracking code. Your web tracking codes are stored in containers, which can be easily installed sitewide and then be remotely modified.
Google Tag Manager containers also allow for easy bulk changes and implementations. If, for example, you wanted to add a specific tracking code on a number of pages, rather than manually adding it to each page, you can simply write a rule that only places the code on pages matching the rule’s criteria.
We’ll talk more about using Google Tag Manager in future lessons. For now, just know that it’s an alternative way to add tracking code to your website and can drastically reduce the amount of technical implementation time needed for adding or modifying web tracking codes.
The Interface
Your Analytics home screen lists the properties for which you have installed Analytics.
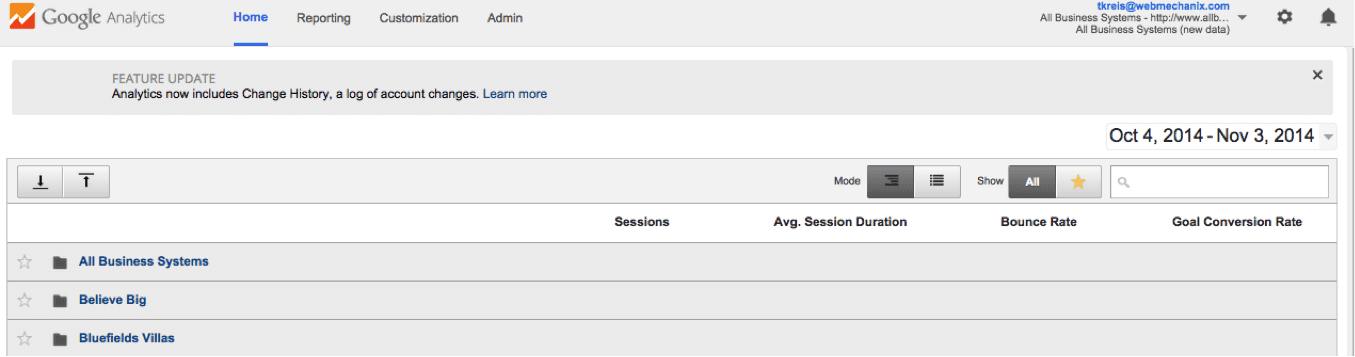
Each property can house multiple websites. For instance, if our greeting card company, Things by Bean, had a main website and a secondary website used at conventions and other events, both would be housed under a single Google Analytics property.
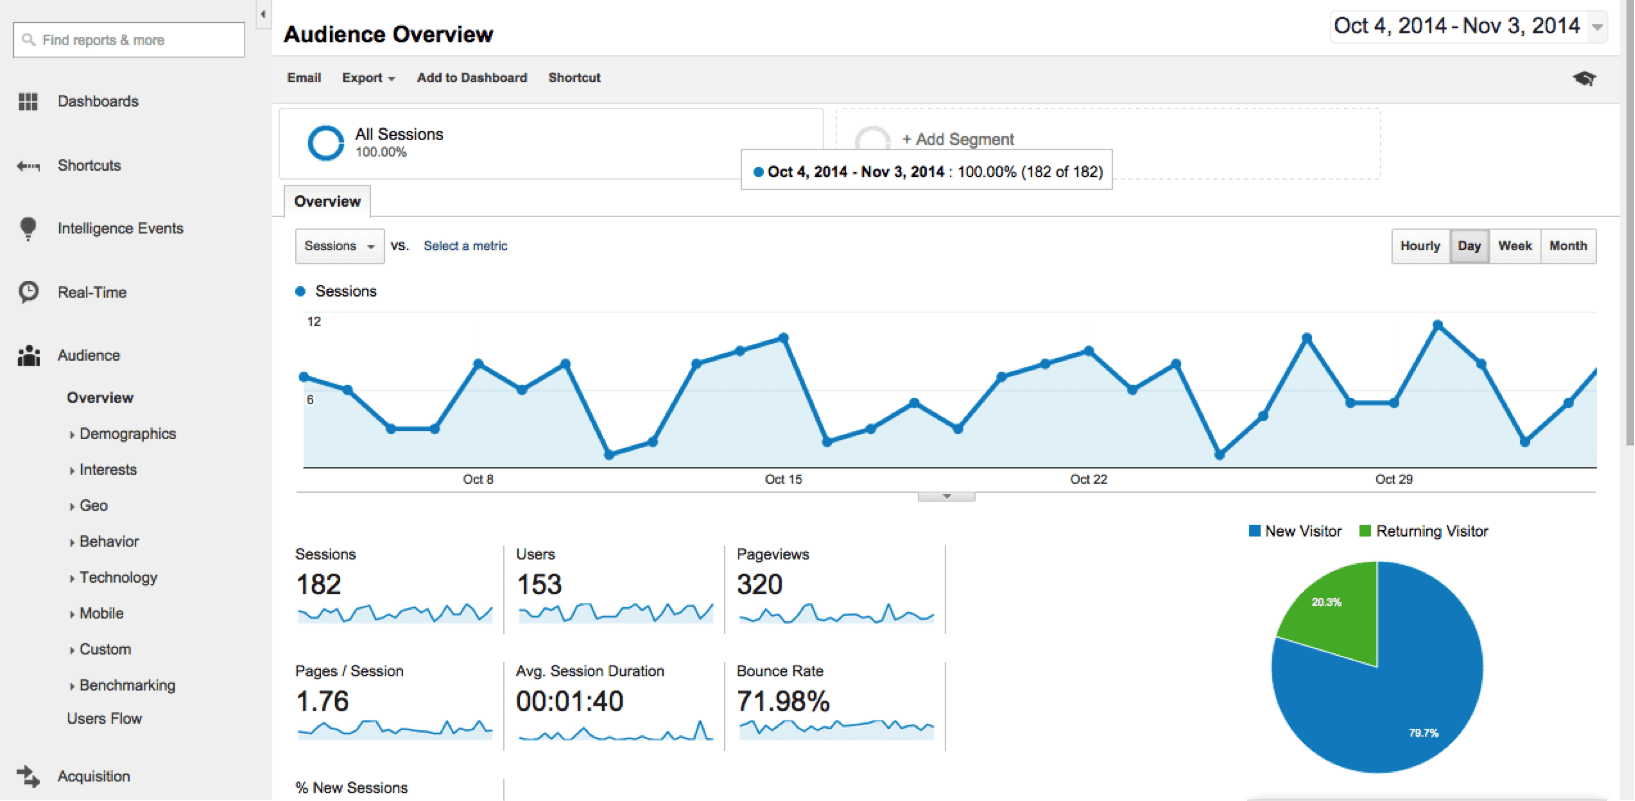
By default, Analytics opens to the Overview section of the Audience category. It shows basic information, including a graph of the sessions on your site over time and the number of users.
Date Ranges
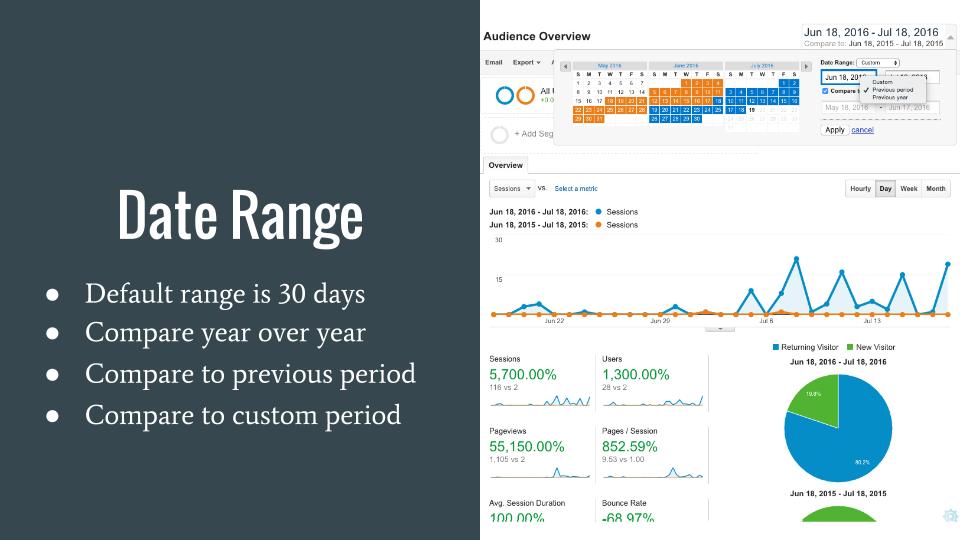
The default time range in Analytics is the previous month. You can set the date range by clicking on the dates shown in the upper right hand corner of the screen. You can also compare two separate time frames. To do so, check the Compare option and enter your second date range in the provided fields.
Analytics should stay on that date range throughout your session. However, it’s a good idea to double check that your date ranges are consistent as you navigate through Analytics, as different date ranges will deliver different data sets.
Dimensions and Metrics
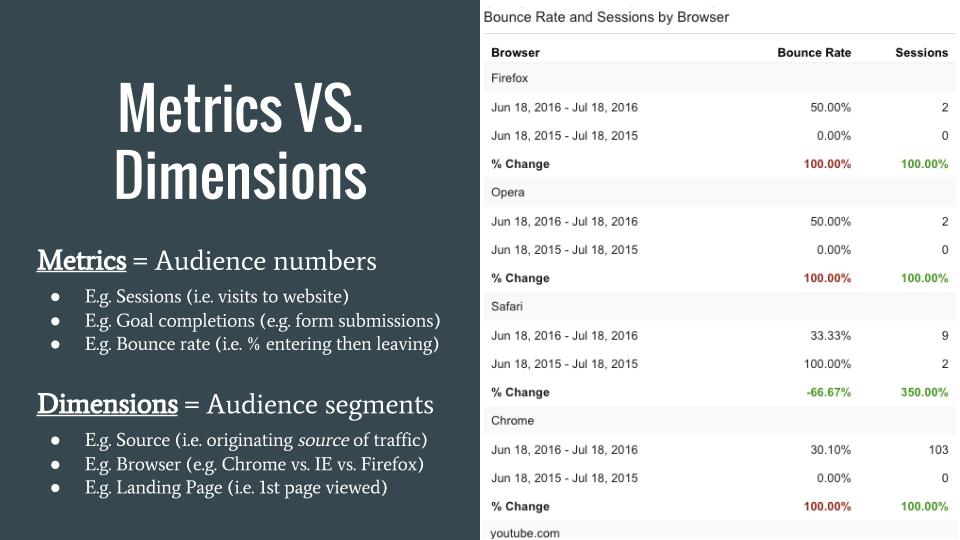
Dimensions and metrics will be covered more extensively in another lesson, but it’s valuable to know about these elements as you make your way through Analytics.
A dimension is a category such as browser type or page title. A metric, on the other hand, is how those dimensions are measured. For example, if we wanted to see how many visitors came to our site using Firefox, the dimension would be browser type, and the metric would be the number of visitors.
You can use dimensions to filter your data in any section of Analytics. This option can be found below the graph of the information and above the data table.

The Four Major Sidebar Sections
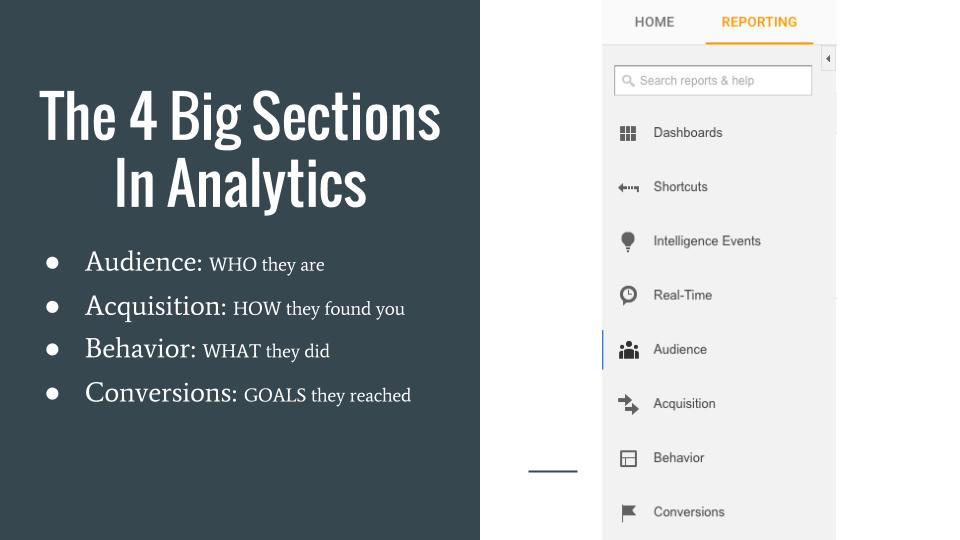
The left side of the page contains several sections and most of your navigation will be done here. The first four options are Dashboards, Shortcuts, Intelligence Events, and Real Time.
We’ll discuss how to use these sections in our more advanced Google Analytics lessons.
For now, we’ll be talking about the next four sections found on the sidebar and the types of data they contain in Analytics.
The four major sections of Google Analytics navigation are:
Audience
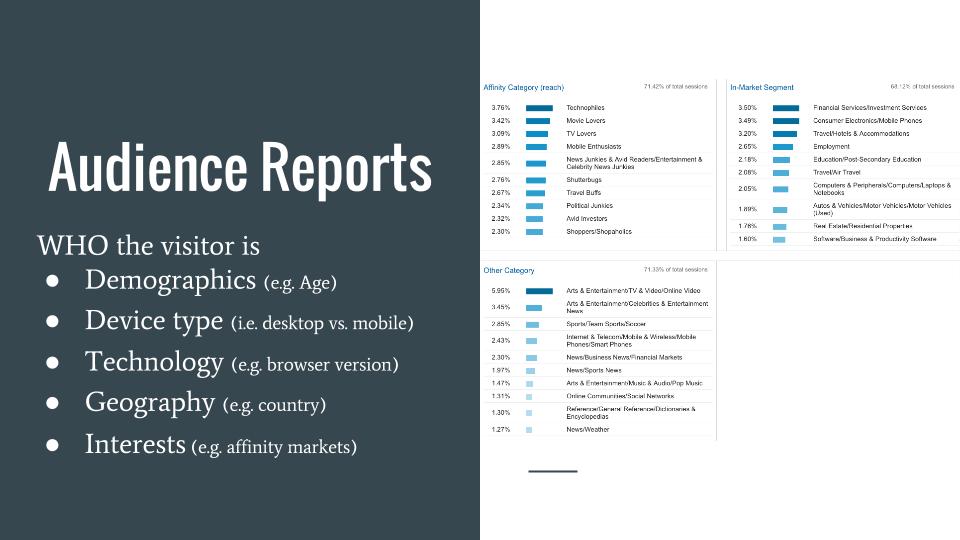
You can find information about who your visitors are in the Audience tab in the sidebar.
We’ll only be discussing a few of the subsections in the Audience reports for this lesson. If you’d like more information about one of these sections, you can click on it in the table to learn more from Google’s help articles, linked below.
Audience Overview
The Audience Overview section provides general data about the users on your site, such as how many users have visited the site, the language they speak, and how many of them are first time versus returning visitors.
Geo
The Geo category includes information on the language spoken by site visitors and their geographic location. Clicking on either sub option will bring you to a more detailed page.
Behavior
Here’s what you’ll find in each sub tab of the Behavior section of the Audience category:
| Subtab | Data Shown |
| New vs. Returning | How these different types of users interact with the site, for example:
|
| Frequency and Recency |
|
| Engagement | A more visual representation of:
|
Technology
The Technology section of the Audience tab includes data on two topics:
- Browser & OS: See which Internet browsers visitors are using to access your site and their operating system (ie. if they have a Mac or a PC)
- Network: See which Internet provider your users have
Mobile
Under the Mobile sub tab of the Audience section are Overview and Devices options.
- Overview: Presents the breakdown of users who accessed the site via a desktop/laptop, mobile phone, or tablet.
- Devices: Provides more detailed information about the machines visitors used when they accessed the site, such as if they were using an iPhone or Samsung Galaxy.
Users Flow
This tab displays a flowchart that illustrates users’ movements throughout the site. This can provide insight into their thought processes and reveal behavior patterns.
Acquisition
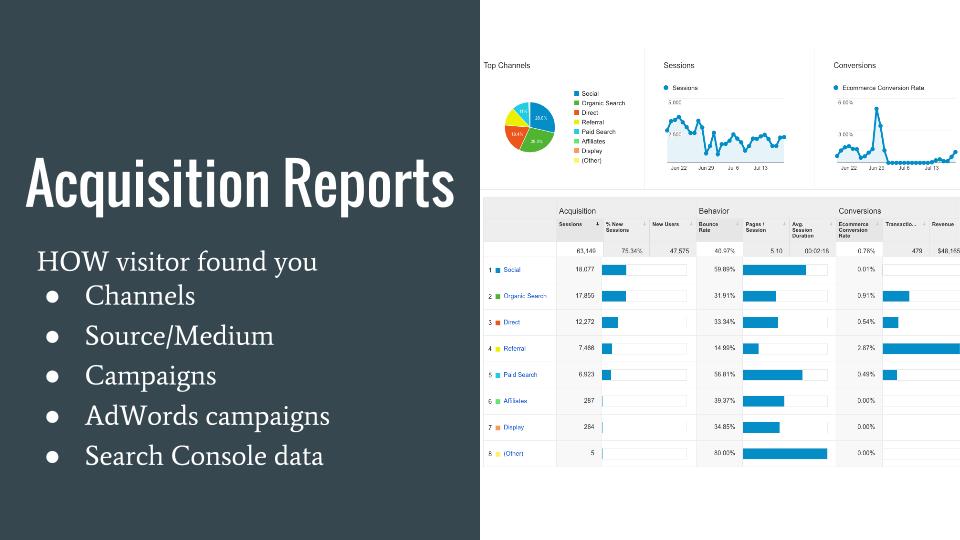
The Acquisition section focuses on how users came to your site. For example, you can see if they found you on Google or through another site.
Most of the commonly used subsections for this category are listed below. We won’t be talking about every subsection in this lesson, so as before, you can read more on Google’s Analytics support site, linked below.
Acquisition Overview
The Acquisition Overview provides a visual snapshot of how users have reached your site. Graphs show the number of sessions over time as well as the distribution of the channels used to find the site.
All Traffic Channels
Channels are the different avenues through which a user can access a site. For example, if you click on a link to a site in Facebook, you would have taken a social channel to get to the site. This tab breaks down how many visitors utilized each channel. Channels include:
- Direct: A user types the exact URL into the address bar
- Organic Search: A user conducts a search on a search engine like Google and they clicked on the result that represented your site
- Referral: A user clicks on a link to your site from another website
- Paid Search: A user clicks on a pay per click advertisement that leads to your site
- Social: A user clicks on a link to your site that was on social media
All Referrals
This section provides detailed information on the traffic to your site that came from referrals. You can see which site individuals came from, and how many people came from that site.
AdWords Campaigns
This section allows you to link to your AdWords account to get more detailed information on visits that were a result of clicking on a PPC ad.
Queries
This tab shows you which queries, i.e. keywords, visitors typed into a search engine that have brought up your site as a result. Hopefully you find that the user clicked through to your site, believing it was a good result that was relevant to their query.
Social Overview
The Social section shows how social media sources have contributed to your site’s traffic. It includes the following:
- Overview: A brief overview of how social networks impact site traffic
- Network Referrals: A breakdown of which social media networks have led to visits to your site, how many visitors, and how engaged those users were
- Landing Pages: Information about user engagement and the number of sessions on the pages visitors landed on when coming from a social media network
- Conversions: Displays the number of conversions from visitors coming to your site from social media
- Plugins: Provides a summary of which content is being “Liked” or “+1” etc.
- Users Flow: A flowchart illustrating the movements of users from social media
Behavior
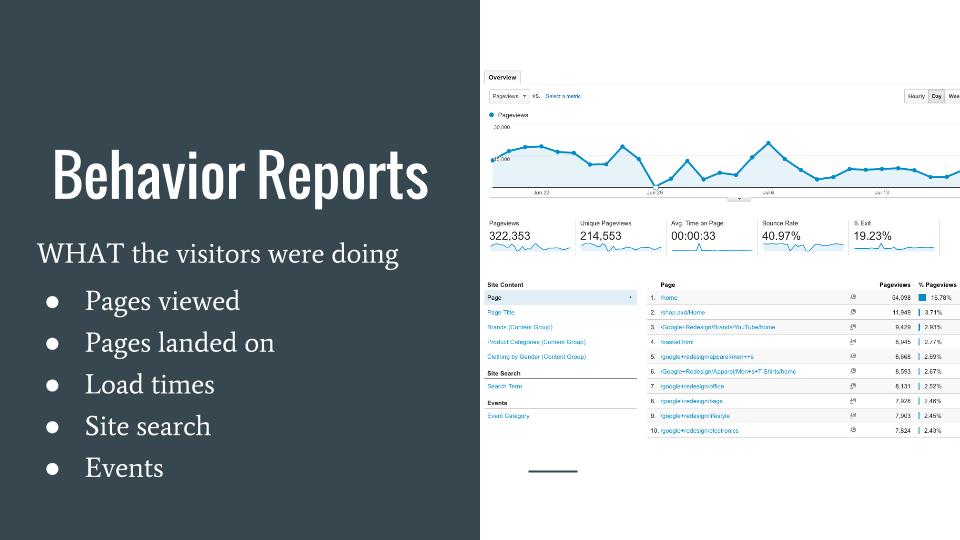
The Behavior section of Analytics provides insight into what your visitors are doing while they are on your site. It includes the following subcategories:
Behavior Overview
The Behavior Overview gives a quick glimpse of how many page views your site is getting, the average amount of time spent on a page, and the bounce and exit rates, etc.
Behavior Flow
Much like the User Flow section in the Audience tab, the Behavior Flow illustrates how users are navigating through the site.
Site Content
The Site Content tab provides the opportunity to dig into the specific data for each page of your site. There are four subsections, including:
- All Pages: Shows pageviews, average amount of time spent, entrances, bounce rates, and exit percentages for each web page. You can toggle between the page URL and the Page Title in the bar above the data table to make the data easier to organize.

- Content Drilldown: Differs from the All Pages tab in that it allows you to compare sections of a website rather than just the individual pages.
- Landing Pages: Provides information on the pages where visitors enter your site. You can find session and engagement information for your landing pages here, as well as goal conversions and completions.
- Exit Pages: Shows the pages from which your visitors leave your site. This data can reveal which pages might need to be revamped to keep users on your website.
Site Speed
This section shows how fast your web pages are loading in comparison to your site’s average, and also provides suggestions to improve load times.
Site Search
The Site Search tab summarizes what users have typed into your website’s search bar, which requires some set-up to track. It has three reporting subsections.
- Usage: Compares the number of visits that did and did not include a search.
- Search Terms: Shows exactly what visitors typed into your site search bar. This information can point to potential improvements for a better user experience.
- Pages: Shows on which pages searches are conducted. Seeing from which pages users are conducting searches can guide your content creation and ensure that all desired information is found on the appropriate page.
Events
Events are specific actions your users complete while they are on your site. You can configure an event to “fire” when a visitor clicks a particular button, submits a form, etc. This section shows you where events are being completed, which occur the most often, and the path users took before they triggered an event.
Conversions
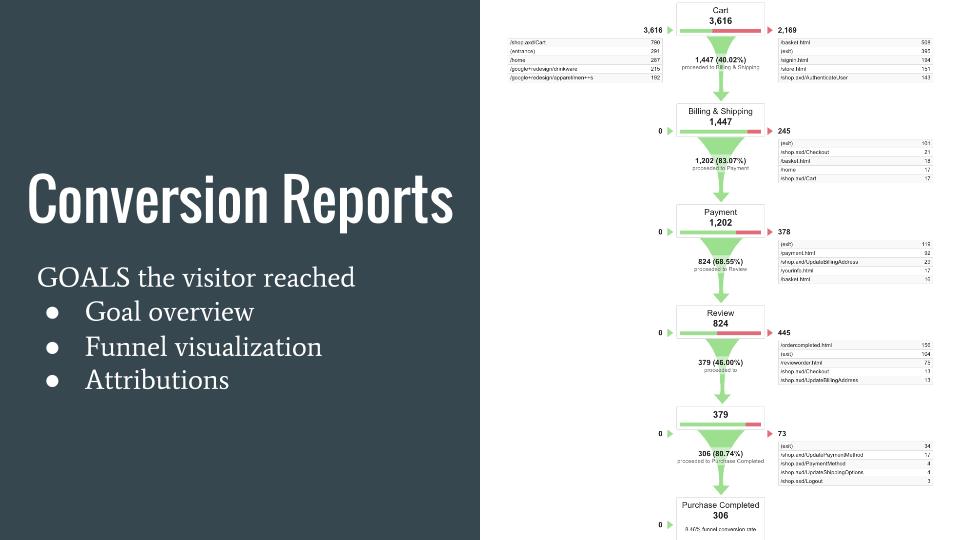
This tab includes four subsections. In these reports, you’ll find out which website objectives your visitors are completing and how they’re being completed.
Goals
The Goals tab has five subsections. We’ll briefly describe the most valuable.
- Goals: Displays the URL for the pages you have identified as a signal to Analytics that a goal has been completed. Note that you have to set up goals for Analytics to track them. We’ll show you how to do this in a future lesson.
- Reverse Goal Path: Shows which pages visitors went to before they completed a goal, giving you an idea of what might have spurred them to complete a goal.
- Funnel Visualization: Highlights the number of users in each step of the funnel. You must have created a funnel to see data. A funnel is a sequence of pages that lead your visitor to complete a goal. To learn more about Funnel Visualization, you can visit this page by LunaMetrics.
- Goal Flow: Similar to Funnel Visualization, but the steps of a Goal Flow are not defined as they are in a funnel. To see the major differences between the two, check out this table from Google.
Multi-Channel Funnels
This section shows how users might see a combination of website referrals, social media mentions, and email campaigns before converting. Since we can’t tell which channel led to the conversion, we can attribute this conversion to the combination of all three. Google’s instructional video provides insight into using the Multi-Channel Funnel functionality.
The Four Tabs at the Top of the Page
Let’s move away from the left sidebar to the tabs at the top of the page. The four tabs are:
- Home
- Reporting
- Customization
- Admin
The Reporting tab is where you’ll spend most of your time, but it’s good to know what you’ll find in the other tabs as well.

Home
The Home tab is where you’ll find your list of properties and the websites associated with them.
Reporting
Here is where you interact with and view the data associated with the property you selected in the Home tab. The left sidebar contains all of the reporting sections that we just covered in this lesson.
Customization
In the Customization tab you can make your own custom reports. We’ll teach you how to build custom reports in an upcoming lesson.
Admin
The final tab at the top of the page is the Admin tab. Here you can change user settings, set up filters, find your tracking code, and more.
Accounts, Properties, and Views
The Admin tab is divided into three sections which define the account structure in Analytics.
- Account: The highest level in Analytics and what lets you access the tool. An account can have multiple properties.
- Property: Essentially, your website. A property can have multiple views.
- View: Different perspectives on or collections of data.
Confused? We’ll use our go-to example to help clear things up.
Our Account would be our company, Online Academy. Properties would include any websites we have, such as thingsbybean.com, and if we have other sites like info.thingsbybean.com. Then, within each property we could have multiple views, such as a view that filters out visits to our site from within our store and one that does not.
So our example could look like this:
Things by Bean (Account) → thingsbybean.com (Property) → All Website Data (View)
Google has an extensive explanation of this account structure here.
Goals
We’ve discussed that goals are actions we want visitors to take while they are on our site (and we’ll discuss Goals & Events again in greater depth in upcoming lessons). You can set up goals in the Admin tab, under the View section.
Here’s what you have to do to make a goal:
- Click the red “+New Goal” button on the left side of the page.
- Name and design your goal. The name should be descriptive so you can easily remember what that goal is.
- Select the type of goal you want to make.
- Fill in the required information.
There are several types of goals that align with different actions users can take on a site.
- Destination Goals: Refer to when a user visits a particular page.
- Duration Goals: Refer to when a user has spent a specific amount of time on a page or site.
- Pages/Screens per Session Goals: Refer to when a user has viewed a certain number of pages on the site.
- Event Goals: Refer to when a user has taken a specific action, such as clicking a “Contact Us” button. An event must be setup before you can make an event goal.
Note that you can only have 20 goals per view and goals cannot be deleted. If you need more goals, you’ll need to create another view or edit an existing goal.
Filters
Filters allow you to place limitations on the data you’ll see in Analytics. This means you can ignore actions you don’t want to include in your data, or focus only on the ones you do want.
For example, if we didn’t want to include our own visits to our company site from our physical store, we could filter out our store’s IP address. With this filter, any of the actions we take on our site at our own store won’t be included in our data, so we won’t skew our own results.
Try These Tracking Exercises
Complete the exercises below before moving on. You’ll gain critical hands-on experience that will help you become the marketer you were meant to be. Plus, it makes completing the quiz at the end of the lesson even easier.
Exercise A: Reading Google Analytics
Effectively reading Google Analytics’ reports comes down to asking yourself a few questions:
- Where did the traffic come from (e.g. search, social, etc.)?
- Where did the traffic go (e.g. homepage, service page, blog post, etc.)?
- What did the traffic do (e.g. purchased, bounced, viewed more pages, etc.)?
So by looking at your sources for the traffic and analyzing their behavior, you can start pinpointing the exact marketing effort that made the impact.
Exercise B: Troubleshooting GA Installation
Google Analytics installation process is fairly easy — you add one small snippet of code in a site-wide element and it begins collecting data.
However, technical peculiarities about your website and other innocent errors can create problems during installation. But thanks to Google’s Tag Assistant, identifying those issues is easier than ever.
Lesson Goal
In this lesson, you’ll learn about your options for advertising on LinkedIn, how to create an ad and sponsored content, and how to review your ads’ performance.
Ad Formats on LinkedIn
There are two basic types of ads available: advertisements and sponsored content.
There are also two styles of ads:
- Image ads can appear in the right column or at the bottom of the page.
- Text link ads appear at the top of the page across the site.
How to Create an Ad
Making an ad on LinkedIn is fairly simple. Let’s work through an example. We’ll say that we want to bring people to a blog post we wrote about why people should send greeting cards.
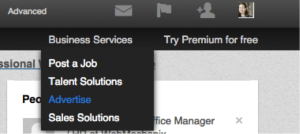
- Log in to LinkedIn. Hover over Business Services and click Advertise.
- On the next page, click Get Started. You’ll then be asked if you want to create an ad or sponsor content. In this example, we’re going to create an ad.
- Next we’ll name our campaign and choose if we want our ad to go to a website or a LinkedIn page. Our campaign name is going to be 8 reasons and we want our ad to go to a blog post on our site.
- Now we create our ads. There’s a 25 character limit for the headline, and a 75 character limit for the text. You can also choose who you want your ad to appear to be from (this should be your company name). A preview will be generated on the right side of the page.
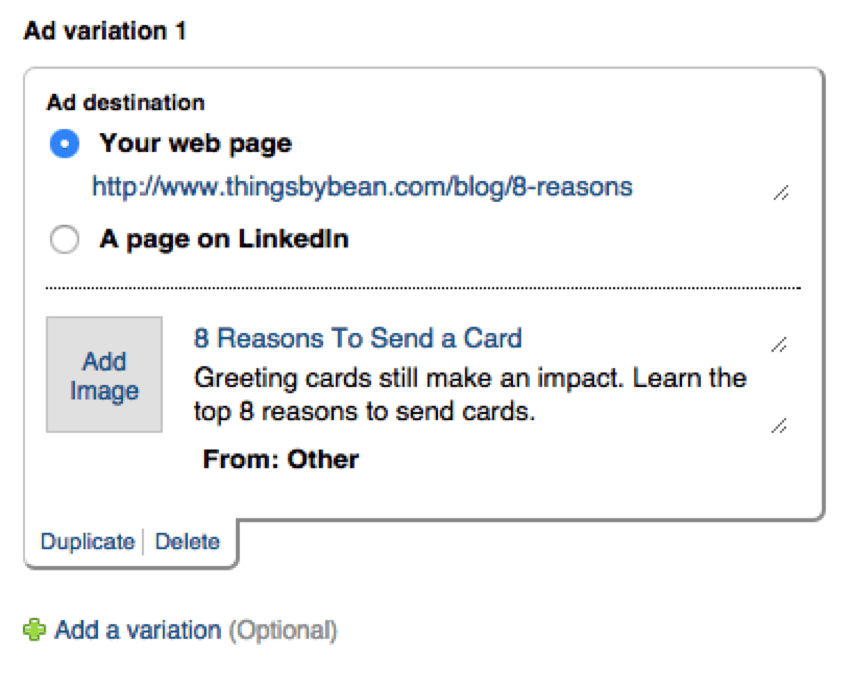
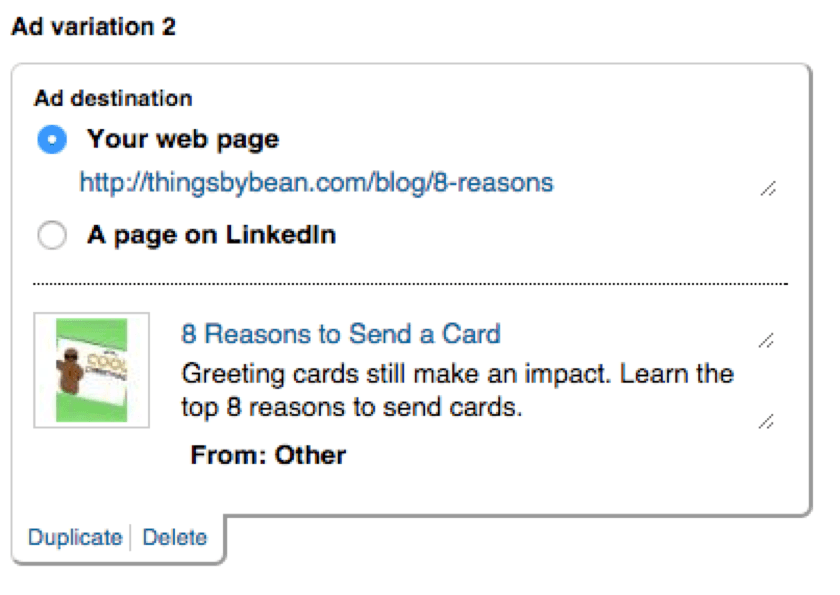
- We’ll click Add a variation so we can make other types of ads. In this next one, we’ll include an image. Using the principles of split testing as a guide, we’ll keep everything the same as in the first ad, but include a picture in this version.
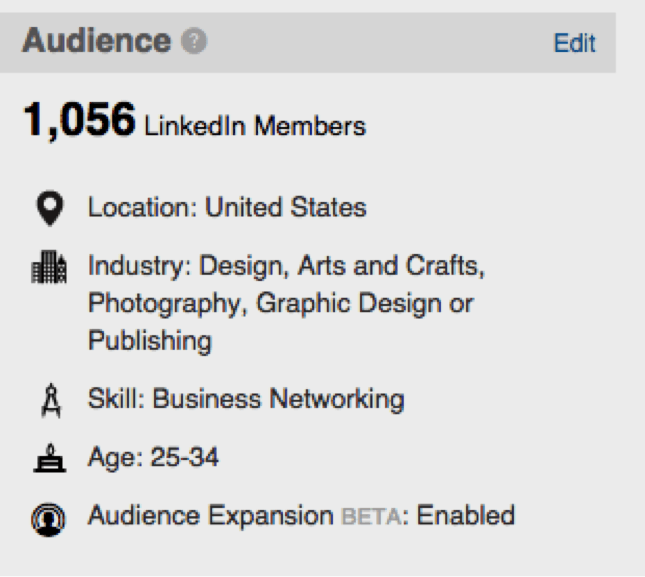
- After clicking Next, we can select our targeting options, including location, which industries and companies we’re targeting, gender, age group, type of degree, and more. We’ll focus on people in art-based industries, who list business networking as a skill (people interested in others are probably more likely to send cards), both genders, and those between ages 25 and 34. We’ll leave audience expansion enabled, because it could further our reach.
On the right side of the page is a summary of our targeting selections, and the total number of LinkedIn members who meet those criteria. In our case, that number is just over 1,000 (the minimum audience size). While that might seem low, remember that these individuals have the traits we want, so they’re more likely to interact with us.
- On the following page, we choose our bidding and budgeting options. You can pay per click or per 1,000 impressions. LinkedIn will suggest a minimum bid for you. In this case, we’ll pay per click, as we want people to click on our ad to see our blog post.
We’ll set our budget to the minimum of $10. We might be charged up to 20% more if people click on our ad right after it’s been turned off and before it stops showing on the site. You can read more about this here.
- We can also determine how long we want our campaign to run. We can set it to run indefinitely, or until a specific date. We’ll set our campaign to run until 12/26/14. Note that you can’t set a specific start date–it will start as soon as you’ve made it. When we click Save Changes we’ll be prompted to enter our billing info.
To add or duplicate a campaign, you can navigate to the Campaign Manager and select Create New Campaign or Duplicate Campaign. To get to the Campaign Manager, simply go to Business Services –>Advertise –>Manage.
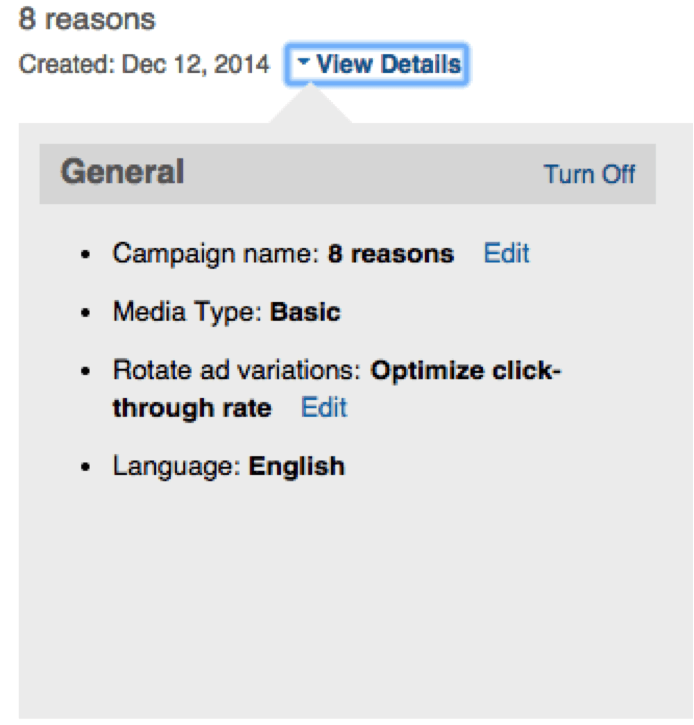
The Campaign Manager is also where you can set if you want to optimize your ads for clicks, or if you want to rotate them evenly. To change this setting, click into the campaign you’d like to change, then click View Details toward the top of the page on the left. Then, under General select the option you’d like and click Save. Again, it’s often better to have the ads rotate evenly to allow you to make the decision on which ad is performing better.
How to Create Sponsored Content
Now we’ll run through how to create sponsored content. Note that you must have a company page to do this.
- Follow steps 1 and 2 to the page that prompts you to create either an ad or sponsored content. Click Sponsored Content.
- Name your campaign. We’ll use the same example, so our campaign name will be 8 reasons. Then select your company from the dropdown. If your company doesn’t have a page, click Add a Company to create a business account or company page.
- Any content you have posted on your company page should appear in the list below the question What would you like to sponsor? Select which ever post(s) you want to sponsor.
- After you’ve made your selections, you should see a preview option that shows you what your sponsored content will look like on a desktop, mobile, or tablet screen. Click Next.
- On the following page, you can choose your targeting options, just as we did when we created an ad. We’ll use the same options here as well. Click Next.
- You’ll have the same bidding and budgeting options as when making an ad. You can select cost per click or cost per thousand impressions as your bidding strategy. In this step, you set your daily and/or total budget, and also how long you’d like your campaign to run. When you click Save Changes, you’ll be asked for your billing information.
- To select if you’d like to optimize for clicks or rotate ads evenly, you’ll need to navigate to the Campaign Manager, and then click Sponsored Updates which will appear at the top of the page. Then click View Details, and choose the option you’d like under General. Be sure to click Save.
Monitoring Performance
To review how your ads and sponsored content are doing, how much you’ve spent, and update notification settings, you’ll go to LinkedIn’s Campaign Manager.
The Campaign Manager is not overly detailed. For ads it shows you the number of clicks, impressions, click through rate, average cost per click, and total value. For sponsored content, these columns are clicks, impressions, click through rate, social actions (likes, shares, etc), average CPC and total value. Total value is the dollars’ worth of advertising you received, but might be more than you actually have spent.
You can adjust the date range and select which metric is graphed, but cannot add or remove columns.
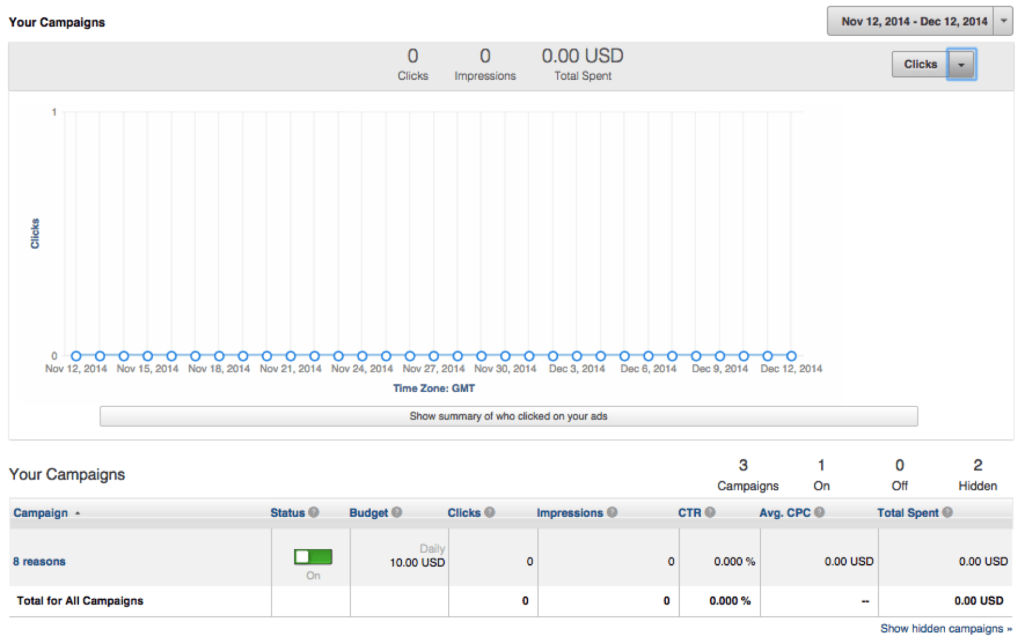
To set notifications settings, click Settings toward the top of the page and then click the checkboxes next to the types of notifications you want to receive.
Viewing Reports
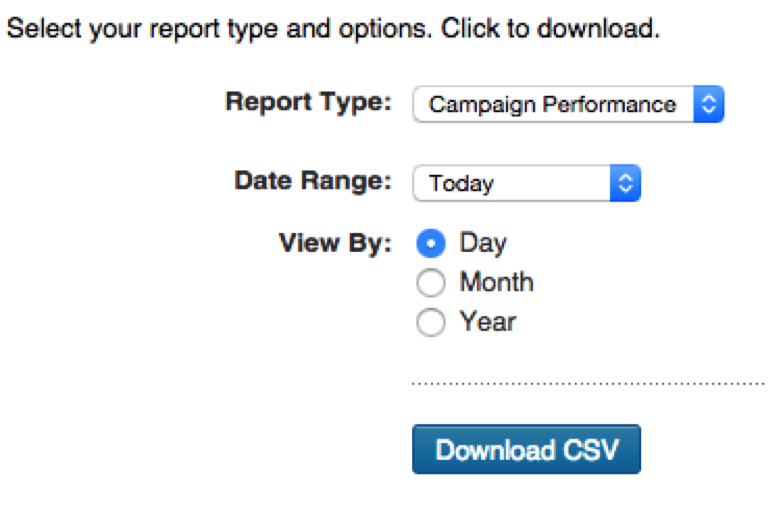
To download reports, navigate to the Reporting tab of the Campaign Manager. You can select if you want to see a campaign or ad level report, the date range, and if you want to view the data by day, month, or year. You’ll be able to download your report as a CSV file.
Why Understanding Metrics, Dimensions, & Other Analytics Terms Is Important
Google Analytics gathers and organizes tons of information from your website and other sources. But to find meaningful trends in that data, you need to understand how that data is organized. And that starts with metrics, dimensions, and other basic components in a Google Analytics profile.
What You’ll Walk Away With
By the end of this lesson you should:
- Have a strong grasp of what metrics and dimensions are and how they are used to represent data in Analytics
- Understand what filters are and how to set them up
- Know how Analytics defines users and sessions
Metrics
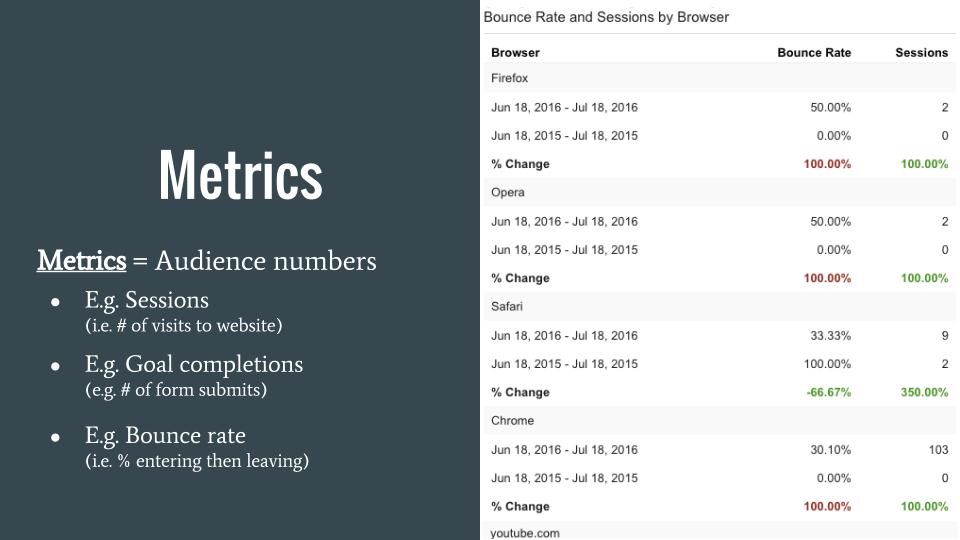
As you move through Analytics, you’ll see that most pages in the “Reporting” tab contain data tables. These data tables contain Metrics and Dimensions that summarize the information about your site.
What are Metrics?
A metric is a quantified value. These numbers represent the data itself and are often sums or ratios.
For example, with our greeting card business, Things by Bean, we will probably want to know how much time individuals spend on our site. This numerical value representing the amount of time is a metric.
One of Google’s examples is that for a city, a metric could be the population, or number of people living there.
Default Metrics in the Analytics Interface
Some metrics are automatically included in the data tables in Analytics. These typically include:
- Sessions
- % New Sessions
- Avg. Session Duration
- Bounce Rate
- Pages/Session, etc.
Some standard reports will use difference metrics. But for the most part, these are the ones on display by default in each standard report in Google Analytics.
Dimensions
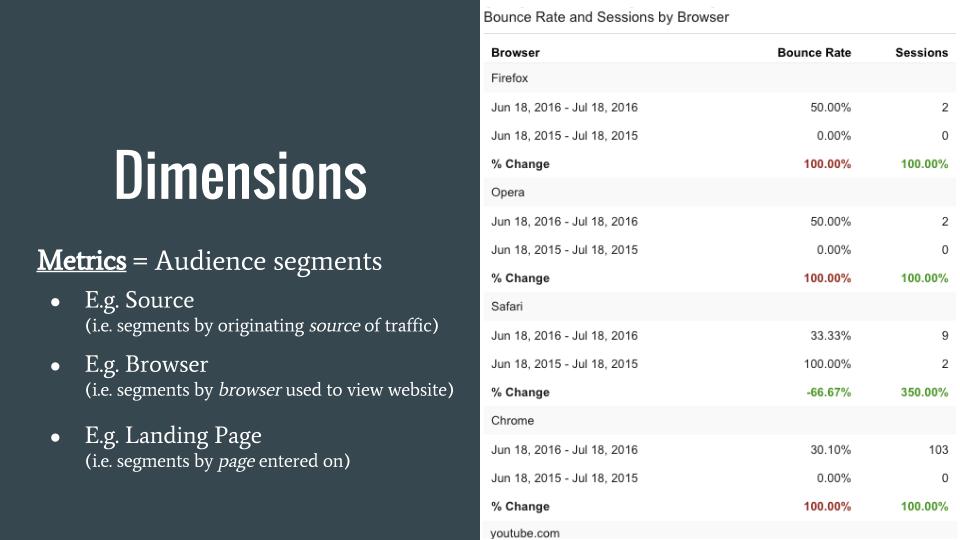
Dimensions are an aspect of the data table that’s shown on most pages in Analytics. Dimensions and Metrics work together to communicate your site’s data. You can read Google’s explanation of how Dimensions and Metrics are related by reading this page of the Analytics help section.
What are Dimensions?
Dimensions can be thought of as attributes that categorize data. For example, if we want to see how long people are on our Things by Bean website, our dimension would be Session Duration, and the metric to measure it would be the number representing the amount of time.
Dimensions in the Analytics Interface
Each of the information tabs in Analytics has specific Dimensions that are used to best express that category of data. While many of the Dimensions shown on each page are the same, they can differ based on the data being described. You can also specify dimensions in custom reports, which we’ll discuss in an upcoming lesson.
Filters
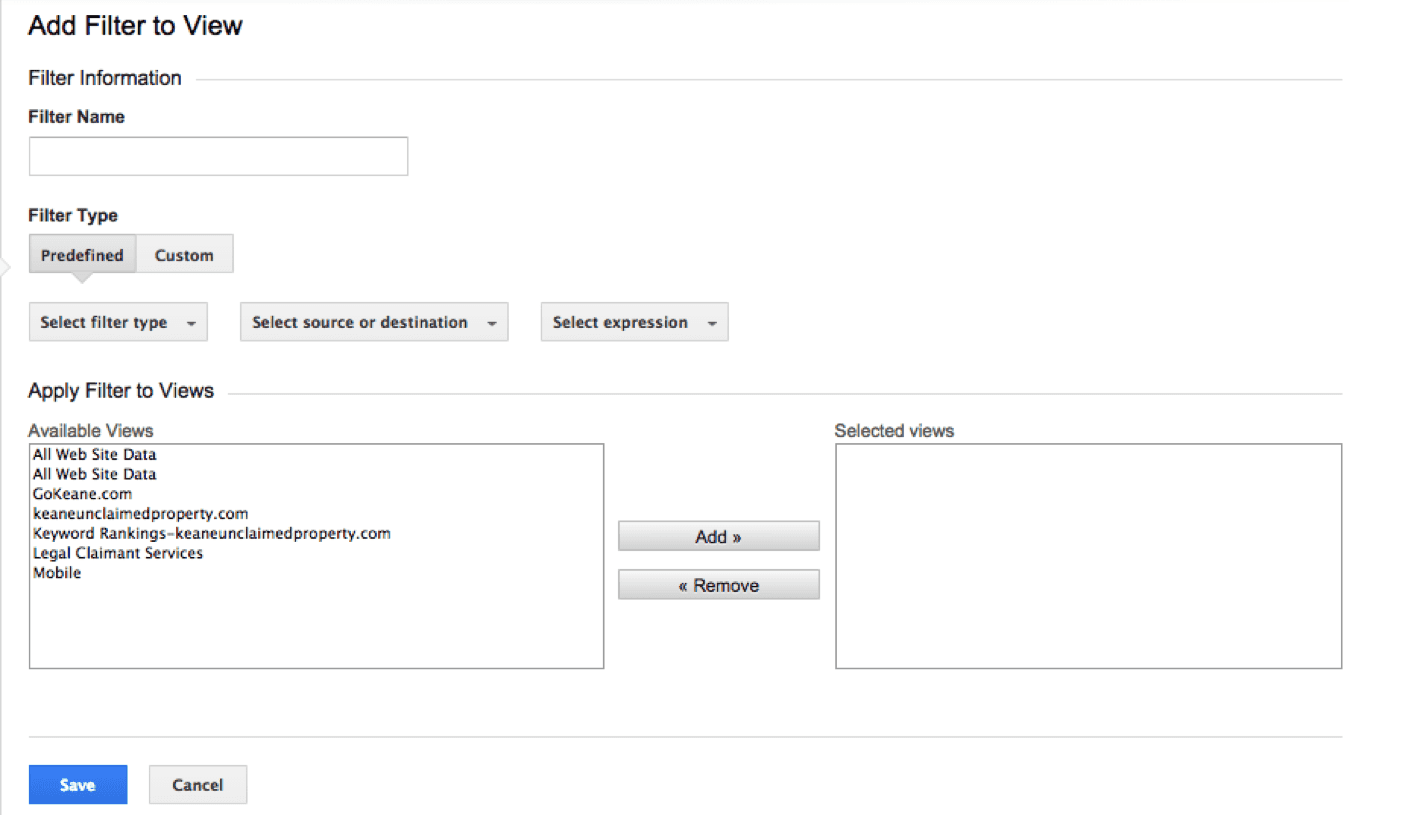
Sometimes there are sources of data that you specifically want excluded or isolated in your Analytics reports.
Filters allow you to do just that — select which particular traffic sources are reported on in Analytics.
Why Use Filters?
It’s essential that Analytics report only on relevant data so you get the most accurate picture of your online performance. If you do not exclude traffic sources that are biased, you can skew your data.
For instance, if we did not exclude web traffic from our Things by Bean store in Analytics, the number of visits and interactions etc. would be inflated and we wouldn’t have a realistic picture of our site.
How to Setup a Filter
To setup a filter, you’ll need Edit permission at the account level:
- Navigate to the Admin tab, and click All Filters, which is under the Account column.
- Then click + New Filter and Create New Filter. You’ll be prompted to create a name for your filter. Make sure you choose a descriptive name so you understand exactly which sources of traffic are being limited.
- Next, select either a Predefined Filter or a Custom Filter. You can learn more about the different types of filters and their purposes here. Use the dropdown menus to select if you want to include or exclude the traffic source or destination, which type of traffic you want to limit, and finally the expression that will specify the exact source/destination.
- Make sure you apply the filter to the appropriate view(s), click save, and you’re done!
An Example of Setting Up a Filter
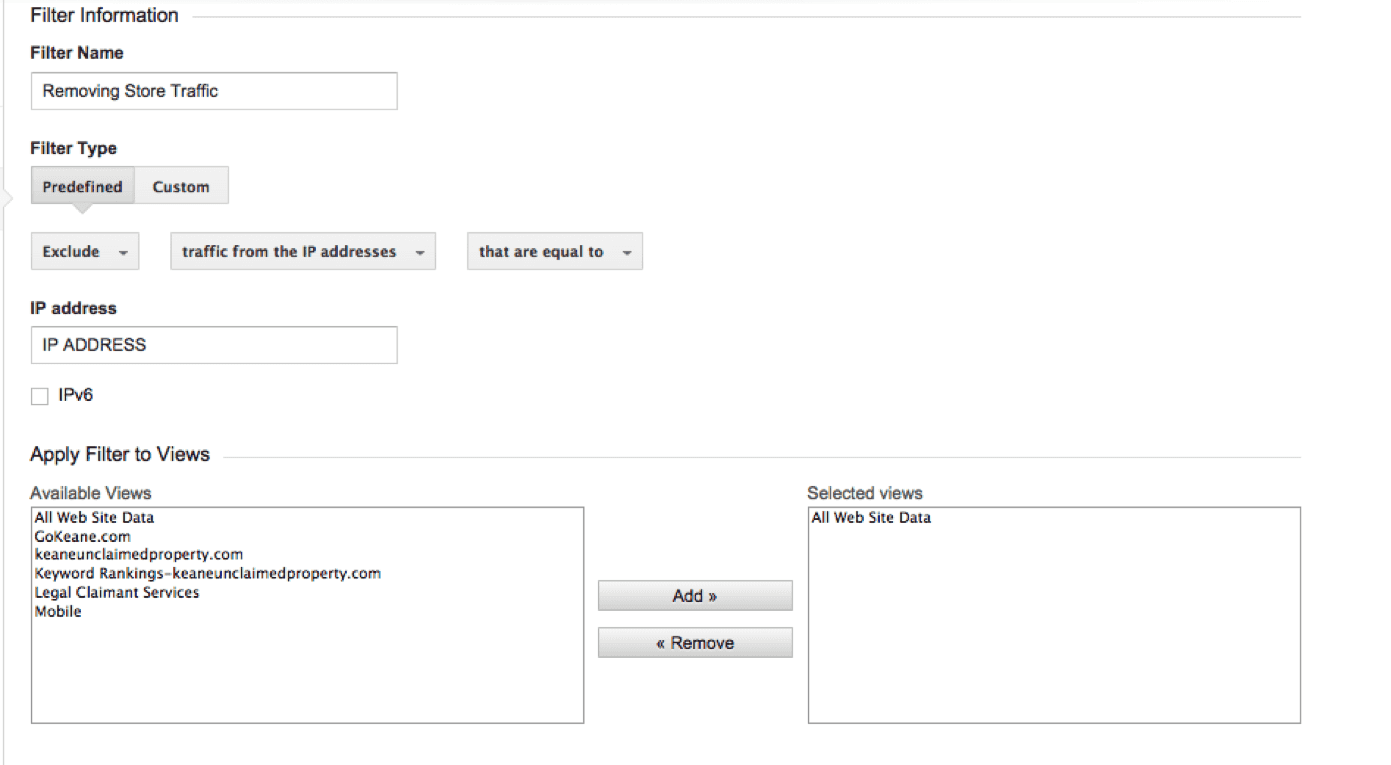
Let’s say Things by Bean wants to make sure that no traffic in Analytics is from sessions on the business’s IP address (since it’s likely an employee, not a prospective buyer). Once we’ve navigated to our Create a Filter page, here’s what we do:
- Create a name. We’re going to name our filter “Removing Store Traffic.”
- We’re going to select our options for a predefined filter.
- For Filter Type, we’re going to select Exclude.
- For Source or Destination we’re going to select Traffic from the IP addresses. Using an IP address is an easy way for us to identify where traffic is coming from and ensure that no traffic from our store comes through to Analytics. If you don’t know how to find your IP address, go to Google and search “What is my IP?” It should come right up!
- Our expression will be That are Equal to because we know exactly which IP address we want removed, and we don’t want to exclude any other traffic with this filter.
- We then need to enter the IP address we want to block from Analytics.
- Pick which views will have this filter. We’re going to select All Web Site Data because we want to be sure that every view in Analytics has our store’s traffic excluded.
- Click save, and that’s it! The end result should look like this:
Sessions & Users
Sessions and Users refer to the way you categorize website hits. Simply put, a User can visit your site multiple times, creating multiple Sessions.
What are sessions?
Sessions are the actual visits to your website. A user can take multiple actions on your site within one session. For instance, a customer could browse birthday cards, our brand new cards, and make a purchase during the same session.
What are users?
A user is an individual who visits your site. Note that just as an individual can visitor your site multiple times, a single user can have multiple sessions on your site.
- Google’s help article explaining how a Session is defined
- Google’s help article explaining how a User is defined
- Google’s help article on how count of Sessions is calculated
- Google’s help article explaining how a User is calculated
- Google’s help article explaining the beenfits of User ID
- Google’s help article on the difference between Entrances and Sessions
- Google’s help article on using Sessions in Custom Reports
- Google’s help article on Session timeout handling
Try These Tracking Exercises
Complete the exercises below before moving on. You’ll gain critical hands-on experience that will help you become the marketer you were meant to be. Plus, it makes completing the quiz at the end of the lesson even easier.
Exercise: New Analytics View
A good rule of thumb for Google Analytics is to always have at least 3 different views:
- Master View (i.e. where you’re most often reporting from)
- Test View (i.e. where you test your filters, etc.)
- Raw Data View (i.e. an untouched, filterless view for comparison)
Exercise: IP Filter
Your Google Analytics account will register any interaction with your website — including interactions from you and your team members. So, to avoid skewing your audience interaction data, it’s often best to exclude any interactions originating from your organization. And the simplest way to do this is by filtering out activity from your IP address.

Why a Keyword Universe is Important
A keyword universe lets you consolidate the findings of your keyword research and share those results with anyone else who may need it.
Keyword research is used by your content strategists to inform their creation and optimization strategies. It’s used by paid media managers to target their campaigns. It’s used by your SEO team to understand where on-site and off-site opportunities may be. It’s used by UX specialists to better understand page priority and user preferences.
In short, keyword research helps everyone on your team. And rather than having each discipline conduct their own research, everyone can reference the keyword universe — a living, breathing document that grows alongside the subject’s research.
What You’ll Walk Away With
At the end of this lesson, you’ll know how to:
- Locate and research keyword data for your market
- Identify the best keywords to use in your marketing campaigns
- Compile your research into an actionable keyword universe
Defining a Good Keyword
A keyword is a word or phrase commonly used to locate content on the web.
Keywords come in all types and sizes, depending on:
- Where the keyword is used (e.g. Google Search vs. Amazon vs. Wikipedia)
- What the keyword is used for (e.g. finding something vs. buying something vs. learning something)
Short-tail keywords—keyword phrases of three words or less—tend to be used for informational searches with little buying intent, e.g. “red widgets.” However, for websites primarily in the information business (e.g. Wikipedia), they’re highly desirable targets.
Most businesses are primarily hoping to attract transactional — not informational — search traffic from users in later stages of the buyer journey and who are searching with long-tail, multi-word phrases, e.g. “best red widget sellers near me.” That’s not to say informational keywords can’t be leveraged to improve a transactional experience, but that’s typically a longer, more difficult optimization process.
Identifying the best keyword for you or your client comes down to:
- Knowing which keywords are relevant for your website, ads, etc,
- Knowing how many people are using those keywords to search, and
- Knowing how much effort you’d have to exert to successfully use those keywords on your website, ads, etc.
How to Approach Keyword Research
A keyword universe is an actionable research deliverable that can be used for content strategy, PPC strategy, audience insights, and more.
By following the strategy listed below, you’ll always ensure that the research performed can actually be applied to your campaigns. The strategy below covers:
- Aligning your keywords with existing assets & audience intent
- Checking the volume and competition for potential keywords
- Nominating a keyword choice after balancing competition
Once you understand the basics, you can then jump down into the tutorial for actually creating the keyword universe doc.
Align Your Assets with Audience Intent

The key to valuable keyword research is attracting the right audience. For example, if your site only sells men’s athletic shoes then you don’t want to target visitors looking for women’s boots.
When you’re conducting keyword research, you need to ask yourself several questions:
- Is the keyword relevant to your site?
- Example: “magic cards” might be somewhat related to the greeting cards about magic that you sell, but the vast majority would likely be looking for Magic: The Gathering trading cards.
- Would the person searching for this term be interested in buying your product or service?
- Example: “free birthday cards” may be an easy keyword to target, but if few to no visitors arriving on your site via that keyword convert, then the traffic is useless or even counterproductive.
- Do you have content to support the keyword?
- Example: “funny birthday cards” might be a good keyword but if you don’t have anything on your site, your ads, or anywhere else referencing that genre of cards, the visitor’s expectations will be frustrated and they’ll leave your site.
Matching the most common intent of a keyword to your audience’s intent ensures your site, ads, and layout provide the best experience possible, making sure both visitors and algorithms are happy.
Check Keyword Volume

A keyword with perfect intent is of little value if no one actually uses it when they search. That’s why you always need to measure volume — i.e. how many times a keyword is typically used by your audience — and compare it to other keywords.
Usually, the best way to approximate search volume is by using Google’s Keyword Planner. Google is far and away the most popular search engine so its data on keyword volume is more complete than that from other sources.
Determining whether or not a keyword has adequate volume depends on the type of keyword you’re targeting.
Adequate search volume could be as high as 10,000 searches per month for “greeting cards” or as low as 10 for something less frequently sought. So, if you’re targeting something very specific, like business valuations for the oil and mining industry, simply registering some monthly search volume can validate your keyword choice.
For another example, consider “greeting cards” vs. “Lord of the Rings greeting cards.” Both would be great for a greeting card shop that carried Lord of the Rings-themed cards. However, depending on your budget, the objective of your marketing strategy, and other considerations, the lower-volume and less competition for “Lord of the Rings greeting cards” may make that a much better keyword choice.
Test Keyword Competition

Determining how many others you’ll be competing with when using a keyword is another important consideration for keyword research.
Your keyword competition research will a) uncover popular topics competitors aren’t talking about and b) show you when the market is too saturated with content revolving around a keyword idea.
The easiest way to approximate keyword competition is via an “intitle” advanced search query. This is a search that looks for the number of web pages using that specific keyword in their page title. You can try this advanced search by typing intitle:”keyword goes here” into an incognito Google Search.
Google will likely tell you that your search returned thousands of results. This number is highly exaggerated. To find a more accurate number, go to the last page of the search. This can be done by clicking on the 10th page of Google’s results and finding the section of the URL containing “start=90.” Change the number to 990 to reach the last page of Google’s search results, and then click on the actual final page listed at the bottom. The number of results displayed when on that last page will be your intitle competition, e.g. 27 results with “game of thrones birthday card” in the page title.


Balancing Volume & Competition

In a perfect world, every keyword you want to show up for around the web would have a ton of volume and no competition.
Unfortunately, the world is flawed and you can’t always get what you want. So, you’re going to have to balance the need for selecting higher volume keywords with the practicality of less competitive keywords. This is going to take some trial and error — i.e. seeing if your keyword strategy is attracting enough visitors and then assessing whether those visitors are actually converting into customers.
Try This Marketing Exercise
Complete the exercise below before moving on. You’ll gain critical hands-on experience that will help you become the marketer you were meant to be. Plus, it makes completing the quiz at the end of the lesson even easier.
Exercise: Keyword Universe Request

Your keyword research should be referenced and re-referenced time and time again by writers, ad specialists, and more. So, by compiling your findings into an easy-to-share document, you’ll ensure that there are less research redundancies and a bigger cross-channel impact for your campaigns.
Tutorial for Creating a Keyword Universe
Now that you know what makes a good keyword, let’s go through the process of creating a keyword universe.
1. Choose Seed Words
Think about your product or service. Ask yourself, “What phrases would someone use to describe this? What terms would I use to find a similar site?” Using these questions, create a list of about 10-15 keywords that can be input into a keyword tool, acting as seeds for further keyword suggestions.
If you’re having trouble coming up with some intital keyword “seeds”, then visit websites similar to your own and see what words and phrases are commonly used.
Google’s Keyword Planner can even extract relevant keywords from websites. Put the URL of a relevant web page, e.g. Wikipedia page for “search engine optimization,” into the landing page field when searching for new ideas and it will show you what keywords it believes are relevant.
Similarly can use a keyword cloud tool to extract some of the keywords most commonly used by these relevant web pages.
2. Get Keyword Suggestions
Plug your seed keywords into keyword suggestion tools like Übersuggest or Soovle. These tools will provide you with more seed keywords to analyze. Übersuggest adds words or phrases to your search to create long-tail keywords. Soovle suggests keywords that are relevant to the search terms you provide. It is an invaluable tool for keyword research.
3. Check Search Volume
Use Google Keyword planner to collect information on search volume. You can ignore the software’s competition metric as it is solely for AdWords campaigns and is not relevant for generic keyword research ideas. It can give you an idea of what keywords are most likely to have high in-title competition, but it does not provide any concrete data.
Google Keyword Planner also allows you to group keywords into ad groups. Typically ad groups are used for Adwords campaigns, but they can be useful for organizing your keywords into separate categories.
For example, when creating a keyword universe for digital marketing training, it may be useful to create separate groups for keywords relating to lesson topics, job roles of potential learners, etc. Having a list of keywords related to a specific subject can be helpful when it is time to present and use your research.
To export keywords into a handy Excel file, create an ad group, select “Add to Plan” to add keywords to that group, and click the download button to download your Excel file.

4. Organize Your Keyword Research
The Excel file downloaded from Google Keyword Planner will have a lot of additional information that is unnecessary for your keyword research.

Click to enlarge
Keep the columns containing ad groups, keywords, and monthly searches. The rest can be deleted. Next, add columns for intitle competition and volume-competition ratio. Divide the competition by the search volume to get the proper ratio. Use the formula “=d2/c2”.

Click to enlarge
Drag the corner of the box down to the last row of keywords to find the ratio for all of your words. Be sure the column is formatted to show values as percentages.

Click to enlarge
You can continue to organize your keywords by separating the ad groups into different sheets in Excel or by making rows sortable. Ultimately, formatting decisions are up to you. If we did not organize our keywords by ad groups, we could still sort our list by intitle competition. This would ensure that keywords with a low intitle competition were at the top, making it easier to see which words are ideal.
Keywords can also be organized by phrase. This allows you to see the core keyword and all of its long-tail variations in one block. This is useful for comparing phrase variations to make sure you are using the best keyword possible. Organizing by phrase can easily be done by sorting the keyword columns alphabetically.
5. Add Intitle Competition
As previously mentioned, quickly approximating a keyword’s level of competition is via an “intitle” search; you can perform a similar search by typing “intitle:’keyword goes here’” into an incognito Google Search. From there, you locate the last page of results and then record how many other websites cover the same keyword.
If your keyword list is in the hundreds, finding the intitle competition can seem like a daunting task. A free tool called Market Samurai can quickly find the in-title competition and search volume (and even suggest new keywords), but it is glitchy and can be inaccurate.
There are also paid tools such as Moz’s keyword tool you can use to assess keyword competition and skip the heavy lifting. But if you can’t afford a paid tool, we encourage you to research manually for the most accurate results.
6. Balance Volume & Competition
Using the ratio in your keyword universe, you can start getting an idea about which keywords are good and which ones are bad — i.e. good keywords will have high volume and low compeitition, so their ratio % will be lower.
The numbers constituting a “good” volume and “good” competition will vary by:
- How they’re used (e.g. SEO, PPC, etc.)
- Your industry (i.e. other digital savvyness)
- Your position in the market (e.g. established brand vs. startup)
- And plenty of other factors (e.g. other activities supporting the overall effort).
What’s left for you is to try to and use those keywords in your campaigns then adjust your definition of good accordingly.
Why Goals and Events Are Important
Goal and Event tracking are fundamental parts of a Google Analytics installation. Together, Goals and Events map the most important moments on your buyers’ journey.
This is important because knowing where your audience started and stopped during their buying journey is critical for understanding why they started or stopped along their journey.
Armed with this knowledge, you can easily clear any obstacle standing between your audience and your objective.
What You’ll Walk Away With
At the end of this lesson, you’ll know:
- How to nominate Goals and Events in Google Analytics
- How to set up Goals and Events in Google Analytics
- How to troubleshoot Goals and Events in Google Analytics
Defining Goals and Events
Every website has an objective—getting somebody to buy something, fill out a contact form, sign-up for a newsletter, etc. Goals and Events are how you track those objectives.
Goals are used to measure how effective your site is at getting users to complete your target objectives. So each time a user completes your objective (e.g. submits a form), a Goal will fire, logging a conversion in your Google Analytics account.
Events are recorded interactions leading up to a Goal—think of them as milestones. They’re tracked independently from web page level data (e.g. # of clicks a button receives). Events can be used for tracking unrelated to Goals, but those uses are infrequent and often require advanced implementation.
How To Use Goals And Events

Plot important points along the buyer’s journey.
Recall our first lesson, Understanding Intent and the Buyer’s Journey. In that lesson, we talked about the different stages of a buyer’s journey—awareness, consideration, decision, and experience.
Ideally, your website should have one or more objectives for each stage and for your different target audiences.
For example, the ultimate objective during the decision stage for consumers browsing Things by Bean would be completing a purchase. For retailers on Things by Bean, the ultimate objective would be a form submission requesting a wholesale purchase.
After identifying your objectives for each stage of the buying process and audience type, you can create Goals based on the actions that complete the objectives. Then, each time an objective is completed, a Goal (AKA conversion, goal completion, etc.) fires in Google Analytics. In the cases discussed above, we could create Goals for successful purchase completions and form submissions.
Events should be assigned similarly to Goals. Events should reflect the interactions leading up to the completion of an objective. For example, expanding an image for a card may trigger an Event. While this doesn’t equate to a sale, it’s an important interaction along the way to a sale.
Also, two things to note. First, there is a variety of advanced tracking that can be done with Google Analytics Ecommerce tracking. We’ll discuss that in a future lesson. Second, Events can be used for a variety of other purposes (e.g. troubleshooting); goal tracking is simply the most basic use.
Often, it’s easiest to simply click through each page of your website and jot down the elements and objectives you want to track.
Set Up and Test Your Goals
After mapping your Goals to your website’s objectives, it’s time to set up your Goals.
Setting Up Your Goals
To set up Goals, you need to navigate to the “Goal” section in Google Analytics. It’s found in the “Admin” section of the site, under the “View” column. Once in the “Goal” section, click “+New Goal”.

There are several Goal tracking options here. The only option we’re going to discuss is the first one—the Destination Goal.
A Destination Goal is triggered when a user reaches a certain page. Most commonly, it’s the page that shows after somebody completed an objective, so it should be an accurate measurement when you’re trying to determine the effectiveness of your website.
For example, if somebody makes a purchase on Things by Bean, it redirects the buyer to an Order Summary page. We would use the URL for the Order Summary page as the Goal’s destination URL. This way, we’d know precisely how many people successfully submitted an order by looking at the number of Goal completions.

You can also assign a value to a Goal, allowing you to easily view and report on transactions from your marketing campaigns.

If you’re able to calculate the estimated value for that Goal (e.g. ~$110 for wholesale card order requests) then you should do that.
Testing Your Goals
Once you’re satisfied the Goal is properly configured, click “Verify this Goal” option at the bottom of the page. This will use data in your Analytics account to determine if the Goal would have fired in the past 7 days.
If you do not have data in your account that would register as a Goal Completion (e.g. nobody has fulfilled Goal criteria since being set up) then clicking on “Verify this Goal” will not work.
Another way to test Goals would be to complete the triggering action (e.g. making a purchase) and wait 24 hours to see if it’s recorded in Google Analytics. It’s important to keep the time lag in mind when QAing and troubleshooting Google Analytics goals.
Set Up and Test Your Events
Events allow you to establish milestones your visitors will pass through on their way to a completing a goal. Measuring those milestones can help you identify where users are struggling to convert.
Setting Up Your Events
Events are set up by adding a small snippet of code to the website element you want to track, such as a button, a link, etc.
This is what the code looks like:
ga(‘send’, ‘event’, ‘category’, ‘action’, ‘label’, value);
Note: This method is used in Google Universal Analytics. If you’re using an older version, you’ll have to look here for instructions (although they operate very similarly).
When using the code on your site, you’d replace category, action, label, and value with something descriptive.
For example, if Things by Bean wanted to track how many people were clicking on the “Sale” link in their navigation, this is what the code would look like:
ga(‘send’, ‘event’, ‘button’, ‘click’, ‘nav buttons’, 2);
This syntax classifies the event as being in the “button” category, notes that it involved a click, and includes where the action occurred—in the universal navigation.
We won’t go into detail about how to actually paste the code into your website. Installing the code is CMS dependent so there are too many variables to describe here. If you’re struggling with this, we advise working with a developer. You can also refer to Google’s guide to event tracking for developers.
Testing your Events.
You can find existing Events by looking at the “Events” reports found under “Behavior” in Google Analytics reporting.
If there are no Events showing up in your Google Analytics reports, then that could mean:
- You don’t have any Events set up on your website
- The Events are set up but they’re not firing
- Nobody has triggered an Event yet
The best way to test Events is to use the following process:
- Right-click on the page and select “Inspect.”
- Navigate to the “Network” tab and check the “Preserve Log” box.

- Complete the action you are trying to track, such as submitting a form or clicking a button.
- In the “Inspect” window type in “collect,” “pageview,” or “event.” You’ll then see several items under the “Name” section.

Click to enlarge
- Hover over the items in the “Name” section and search for your event category, action, and label. They should be preceded by “ec” for event category, “ea” for event action, and “el” for event label.
It’s important to note that it’s worthwhile to check your events on a regular basis to ensure that they are tracking correctly. If an event isn’t firing properly, it’s best to contact a developer for support.
Try This Tracking Exercise
Complete the exercises below before moving on. You’ll gain critical hands-on experience that will help you become the marketer you were meant to be. Plus, it makes completing the quiz at the end of the lesson even easier.
Exercise: Mapping A Website’s Goals & Events

Setting up goals and events in Google Analytics is critical for understanding the impact of your marketing efforts. By clearly recording when a visitor completes a desirable action, you can better understand which parts of your campaign are contributing the most to your bottom line results.
